Open Access
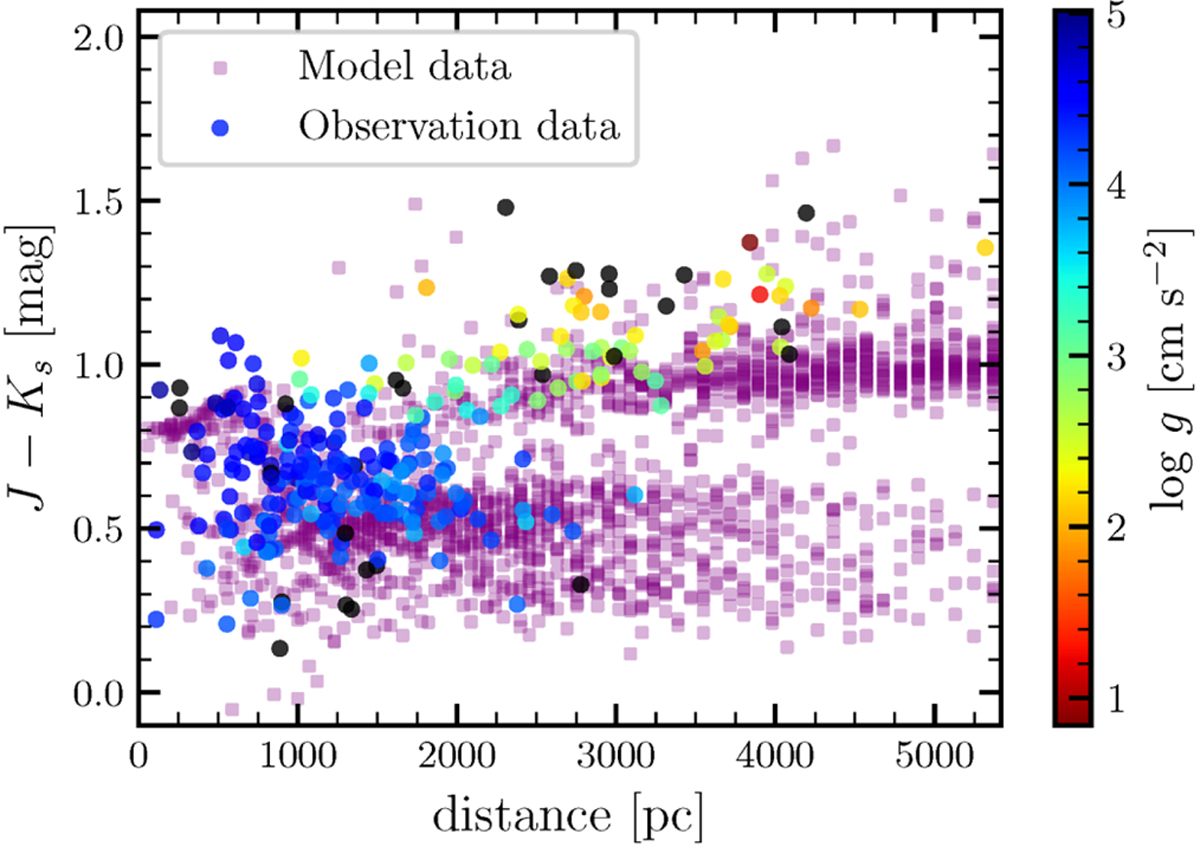
Fig. 4
Download original image
Distributions of the observation and model data in the color-distance diagram for G045.1-03.4. The purple squares represent the model data, the colored points represent the observation data with log g, and the black points represent the observation data without log g.
Current usage metrics show cumulative count of Article Views (full-text article views including HTML views, PDF and ePub downloads, according to the available data) and Abstracts Views on Vision4Press platform.
Data correspond to usage on the plateform after 2015. The current usage metrics is available 48-96 hours after online publication and is updated daily on week days.
Initial download of the metrics may take a while.