Fig. 9
Download original image
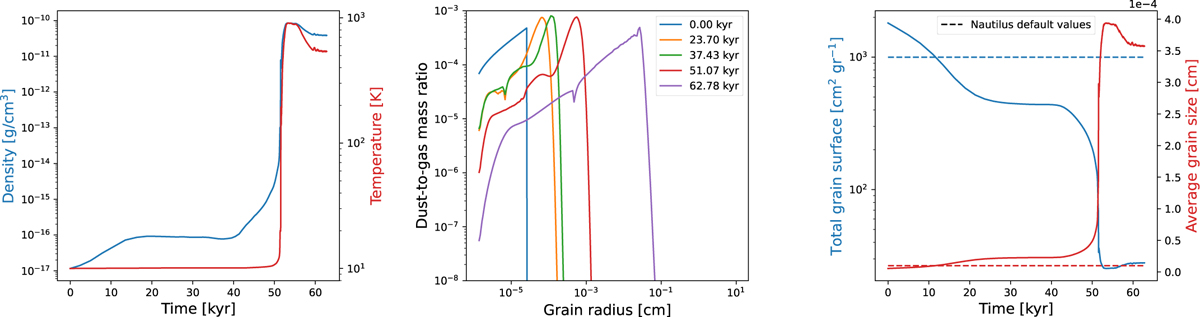
Time evolution of physical properties and their impact on grain size in the hot component. Left: evolution of density (blue) and temperature (red) of the tracer particle selected to represent the hot component. Middle: dust size distribution at several snapshots. Right: time evolution of the total adsorption surface (blue solid line) and average grain size (red solid line). Also shown are the default NAUTILUS values for the total surface (blue dashed line) and average grain size (red dashed line) used in the chemical analysis presented in Sects. 4 and 5.
Current usage metrics show cumulative count of Article Views (full-text article views including HTML views, PDF and ePub downloads, according to the available data) and Abstracts Views on Vision4Press platform.
Data correspond to usage on the plateform after 2015. The current usage metrics is available 48-96 hours after online publication and is updated daily on week days.
Initial download of the metrics may take a while.