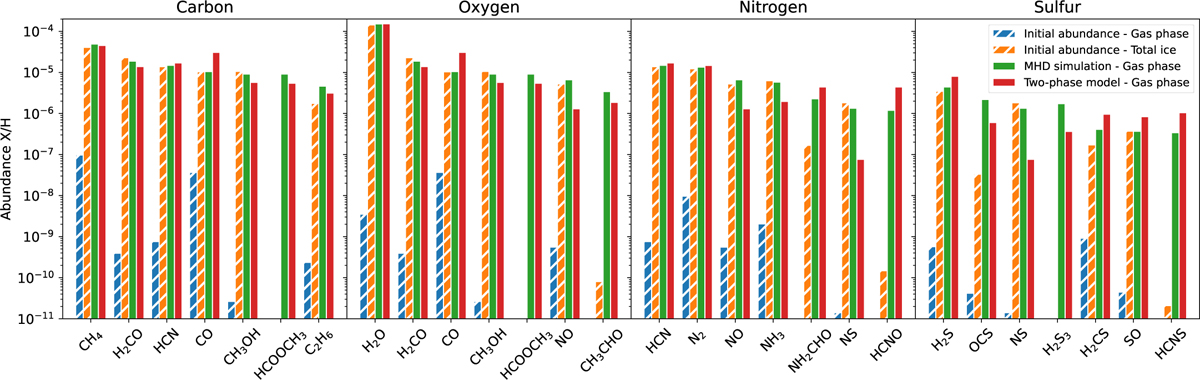
Fig. 7
Download original image
Comparison between the chemical abundances of the main elemental reservoirs in the hot component in four different settings: the initial gas-phase and ice-phase abundances (hatched blue and orange bars, respectively; see Sect. 3), the final gas-phase abundances predicted by the MHD simulation (green bars), and the final gas-phase abundance of the two-step model described in Sect. 5.3 (red bars).
Current usage metrics show cumulative count of Article Views (full-text article views including HTML views, PDF and ePub downloads, according to the available data) and Abstracts Views on Vision4Press platform.
Data correspond to usage on the plateform after 2015. The current usage metrics is available 48-96 hours after online publication and is updated daily on week days.
Initial download of the metrics may take a while.