Open Access
Fig. 4
Download original image
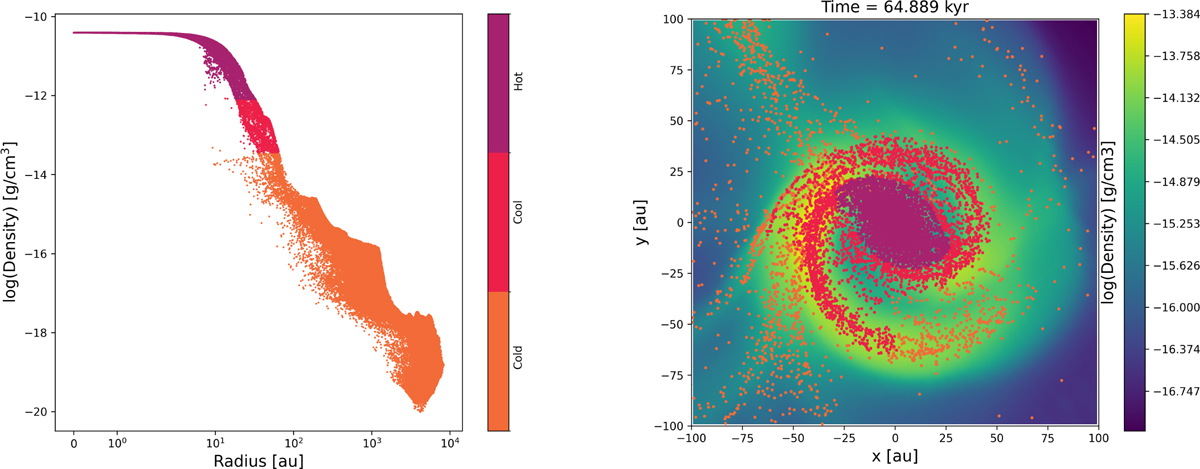
Definition of the temperature components described in Sect. 4.2. Left: values of distance and density of the temperature components. Right: spatial distribution of the temperature components with the same color-coding as in the left panel, overlapped to the face-on density map of the FHSC.
Current usage metrics show cumulative count of Article Views (full-text article views including HTML views, PDF and ePub downloads, according to the available data) and Abstracts Views on Vision4Press platform.
Data correspond to usage on the plateform after 2015. The current usage metrics is available 48-96 hours after online publication and is updated daily on week days.
Initial download of the metrics may take a while.