Open Access
Download original image
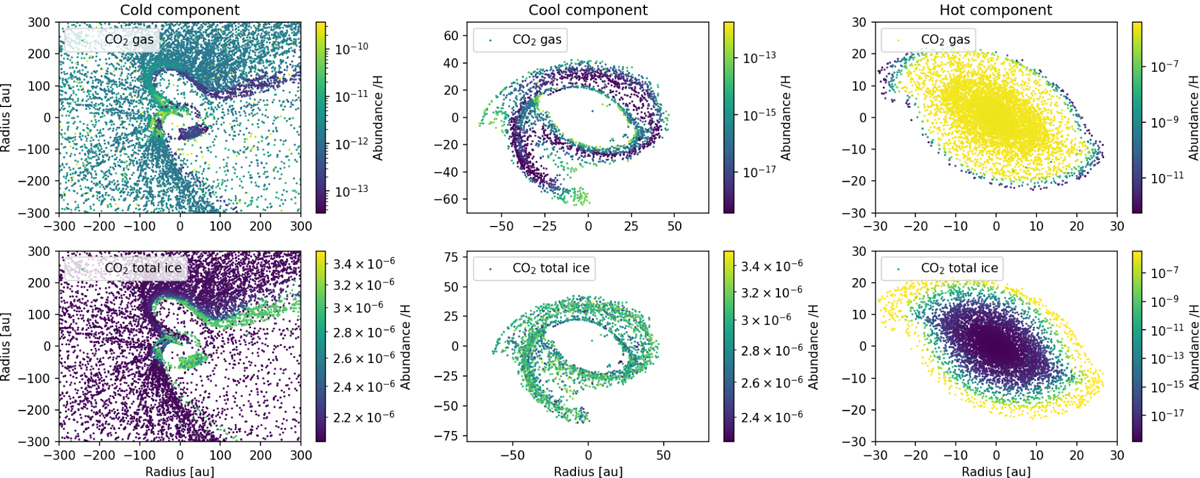
(a) Spatial distribution of the tracer particles at the end of the simulation and their CO2 gas-phase (top row) and total ice-phase (bottom row) abundances for the three temperature components: cold (left), cool (middle), and hot (right).
Current usage metrics show cumulative count of Article Views (full-text article views including HTML views, PDF and ePub downloads, according to the available data) and Abstracts Views on Vision4Press platform.
Data correspond to usage on the plateform after 2015. The current usage metrics is available 48-96 hours after online publication and is updated daily on week days.
Initial download of the metrics may take a while.