Fig. 6
Download original image
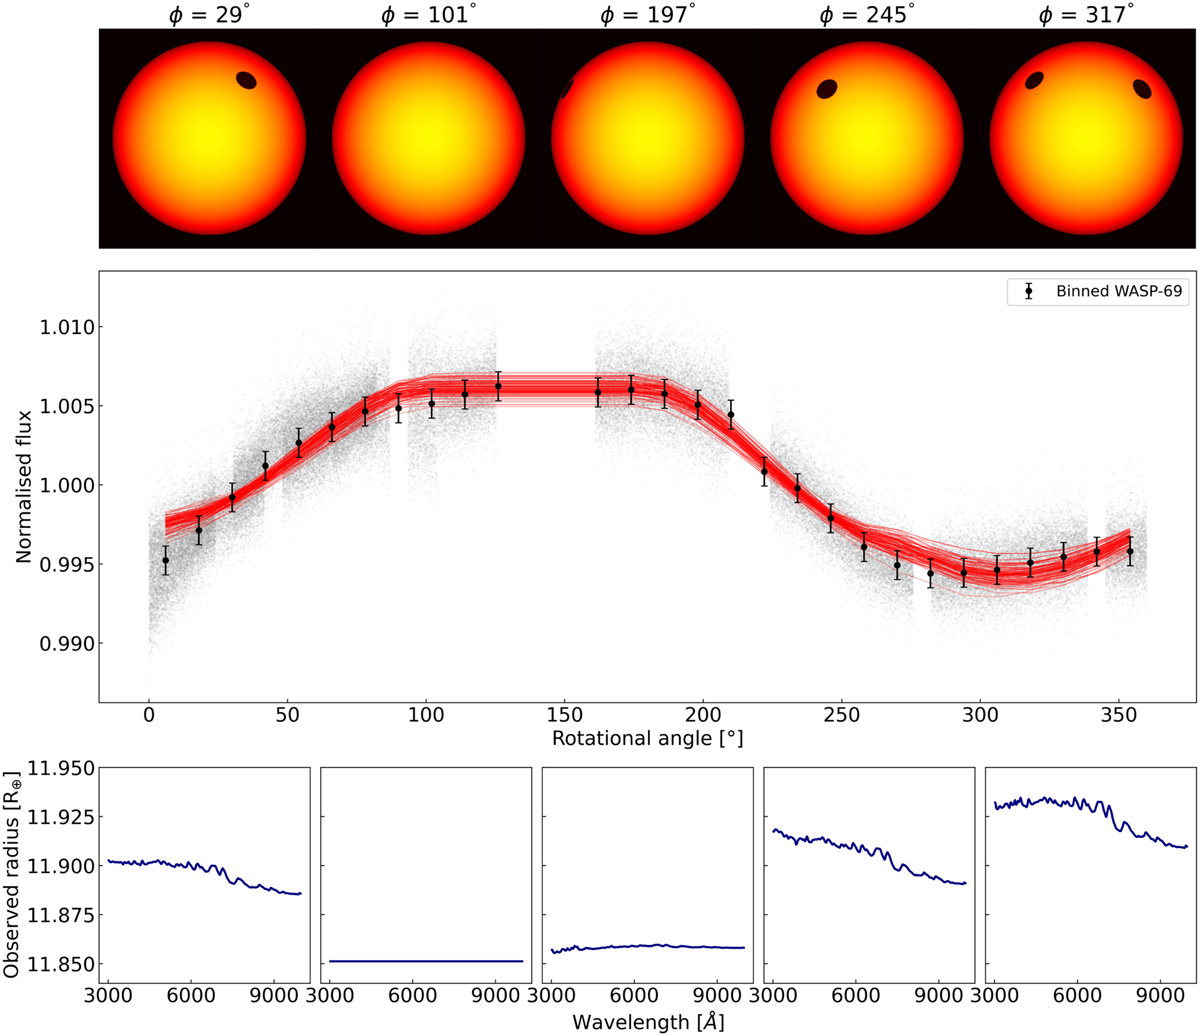
Flux variability models and the expected variability in contamination spectrum of WASP-69. Top: model stellar surface map for variability models associated with the peak of the posteriors. Middle: TESS data of WASP-69, phase-folded on the stellar rotation period. The grey points are the individual measurements, and the black points are the binned measurements. The red curves show 100 variability models randomly selected from the posterior distribution of the fit. Bottom: observed radius of planet b at different rotational phases of the star and different wavelengths.
Current usage metrics show cumulative count of Article Views (full-text article views including HTML views, PDF and ePub downloads, according to the available data) and Abstracts Views on Vision4Press platform.
Data correspond to usage on the plateform after 2015. The current usage metrics is available 48-96 hours after online publication and is updated daily on week days.
Initial download of the metrics may take a while.