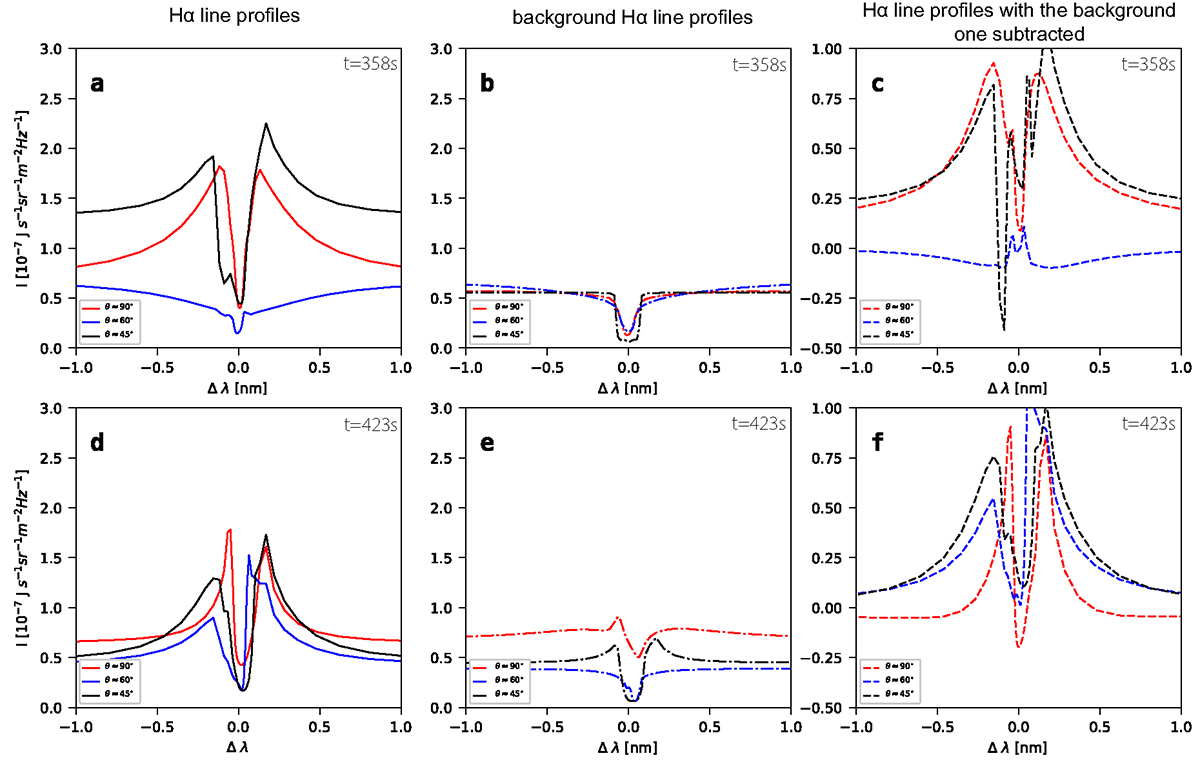
Fig. 8.
Download original image
Synthetic Hα spectral lines at two different times. Panels a and d show the synthetic Hα spectral line profiles along the three different lines of sight (see Fig. 3; the angles are those between the arrows and the horizontal direction.), panels c and f show the background profiles, and panels c and f show the profiles after the ambient background profile is subtracted.
Current usage metrics show cumulative count of Article Views (full-text article views including HTML views, PDF and ePub downloads, according to the available data) and Abstracts Views on Vision4Press platform.
Data correspond to usage on the plateform after 2015. The current usage metrics is available 48-96 hours after online publication and is updated daily on week days.
Initial download of the metrics may take a while.