Fig. 12.
Download original image
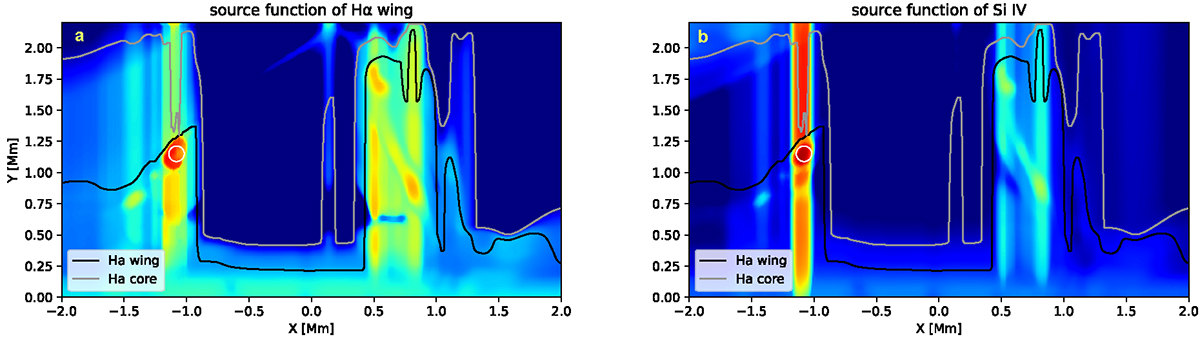
Distribution of source functions in simulation area at t = 423 s. Panel a presents the distribution of source functions for the Hα wings, while panel b shows the source function distribution for Si IV at 139.4 nm. The gray line indicates the location where the optical depth is 1 in the Hα line core, the black line represents the location where the optical depth of the wings is 1, and the white circles serve as reference markers. Lower values are represented in blue, transitioning through green to red for higher values.
Current usage metrics show cumulative count of Article Views (full-text article views including HTML views, PDF and ePub downloads, according to the available data) and Abstracts Views on Vision4Press platform.
Data correspond to usage on the plateform after 2015. The current usage metrics is available 48-96 hours after online publication and is updated daily on week days.
Initial download of the metrics may take a while.