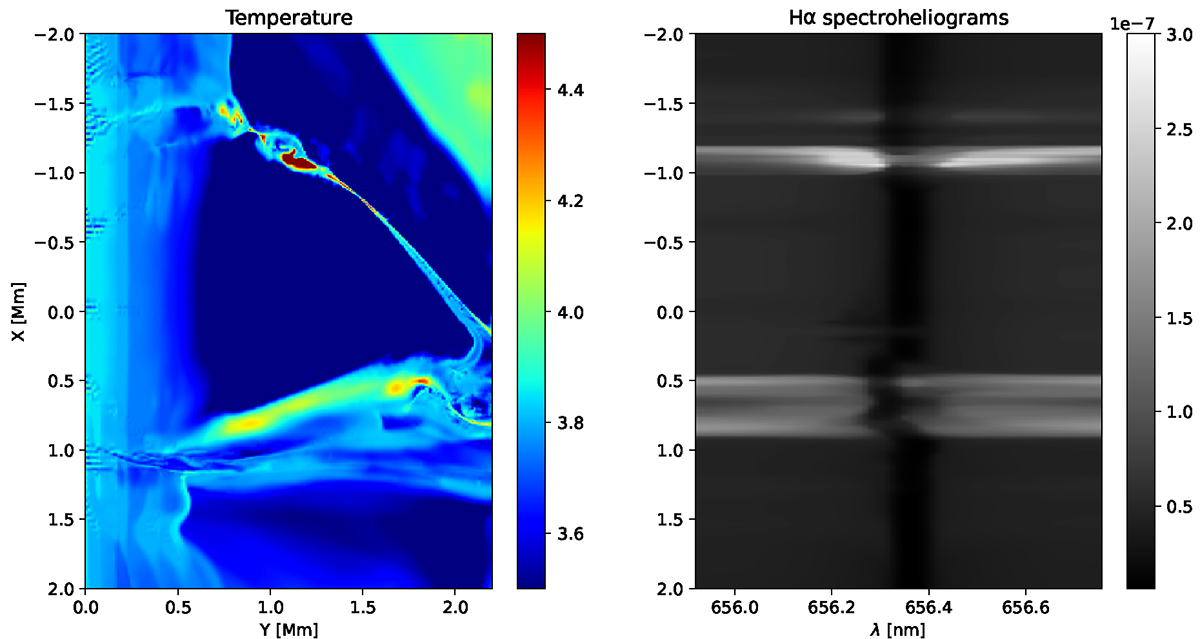
Fig. 11.
Download original image
Temperature distribution and synthetic Hα spectrogram at t = 423 s. Panel a displays the temperature distribution, rotated 90 degrees for better correlation with the location of EBs, with the horizontal axis representing height (y-direction) and the vertical axis representing length (x-direction). Panel b shows the spectrogram synthesized to mimic Ellerman’s 1917 observations, with the horizontal axis indicating wavelength and the vertical axis indicating length.
Current usage metrics show cumulative count of Article Views (full-text article views including HTML views, PDF and ePub downloads, according to the available data) and Abstracts Views on Vision4Press platform.
Data correspond to usage on the plateform after 2015. The current usage metrics is available 48-96 hours after online publication and is updated daily on week days.
Initial download of the metrics may take a while.