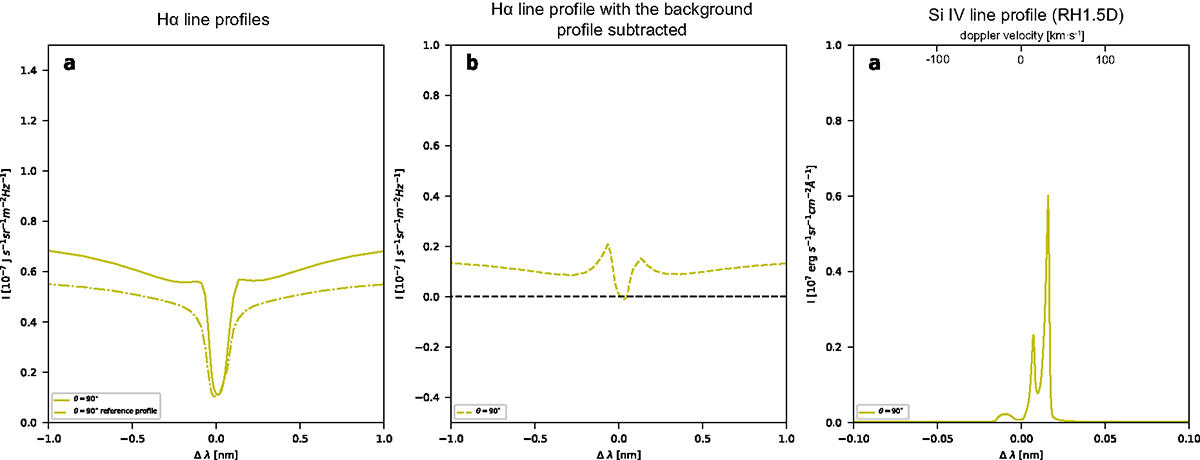
Fig. 10.
Download original image
Synthetic spectral line profiles in the outflow region at t = 423 s along the yellow arrow in Fig. 6. Panel a shows the Hα spectral line profile and the reference profile, (b) shows the result of subtracting the background profile from (a), and (c) shows the profile of Si IV 193.4 nm line. These results are derived by using the RH1.5D code.
Current usage metrics show cumulative count of Article Views (full-text article views including HTML views, PDF and ePub downloads, according to the available data) and Abstracts Views on Vision4Press platform.
Data correspond to usage on the plateform after 2015. The current usage metrics is available 48-96 hours after online publication and is updated daily on week days.
Initial download of the metrics may take a while.