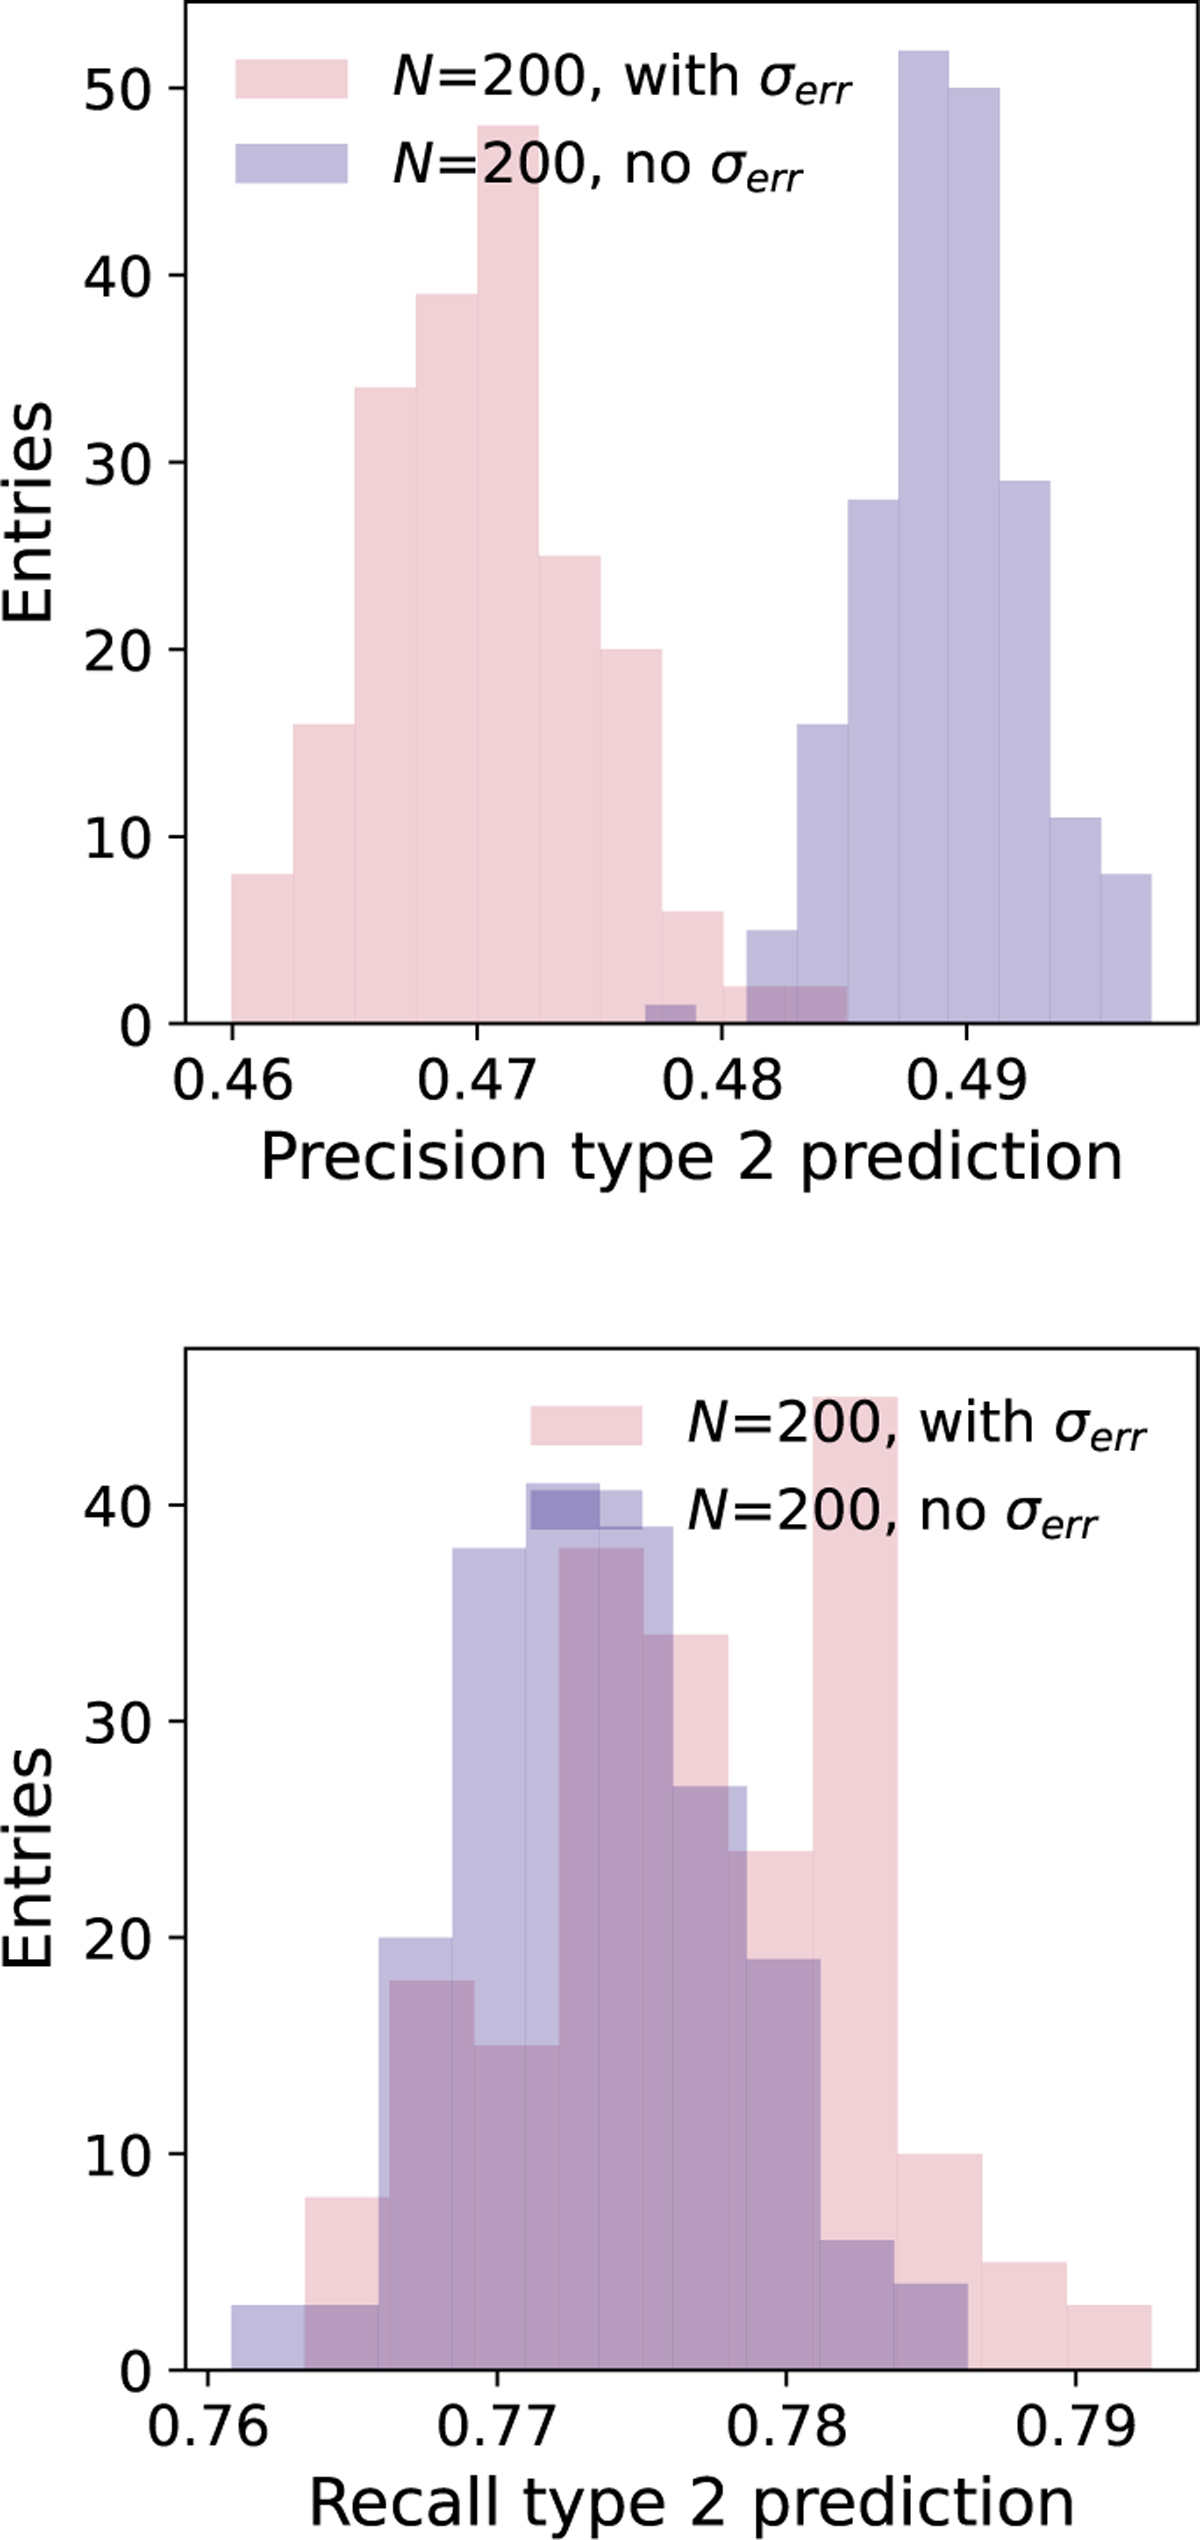
Fig. 7
Download original image
Posterior distributions for the Type 2 precision (top) and recall predictions (bottom) from fitting the labeled dataset N = 200 times. The blue distribution indicate the value obtained from N RF reconstructions without inclusion of measurement errors, while the red distribution correspond to the reconstructions of the measurement uncertainty propagated pseudo-sets. In certain cases, the performance of the classifier is overestimated when photometric uncertainties are not taken into account.
Current usage metrics show cumulative count of Article Views (full-text article views including HTML views, PDF and ePub downloads, according to the available data) and Abstracts Views on Vision4Press platform.
Data correspond to usage on the plateform after 2015. The current usage metrics is available 48-96 hours after online publication and is updated daily on week days.
Initial download of the metrics may take a while.