Open Access
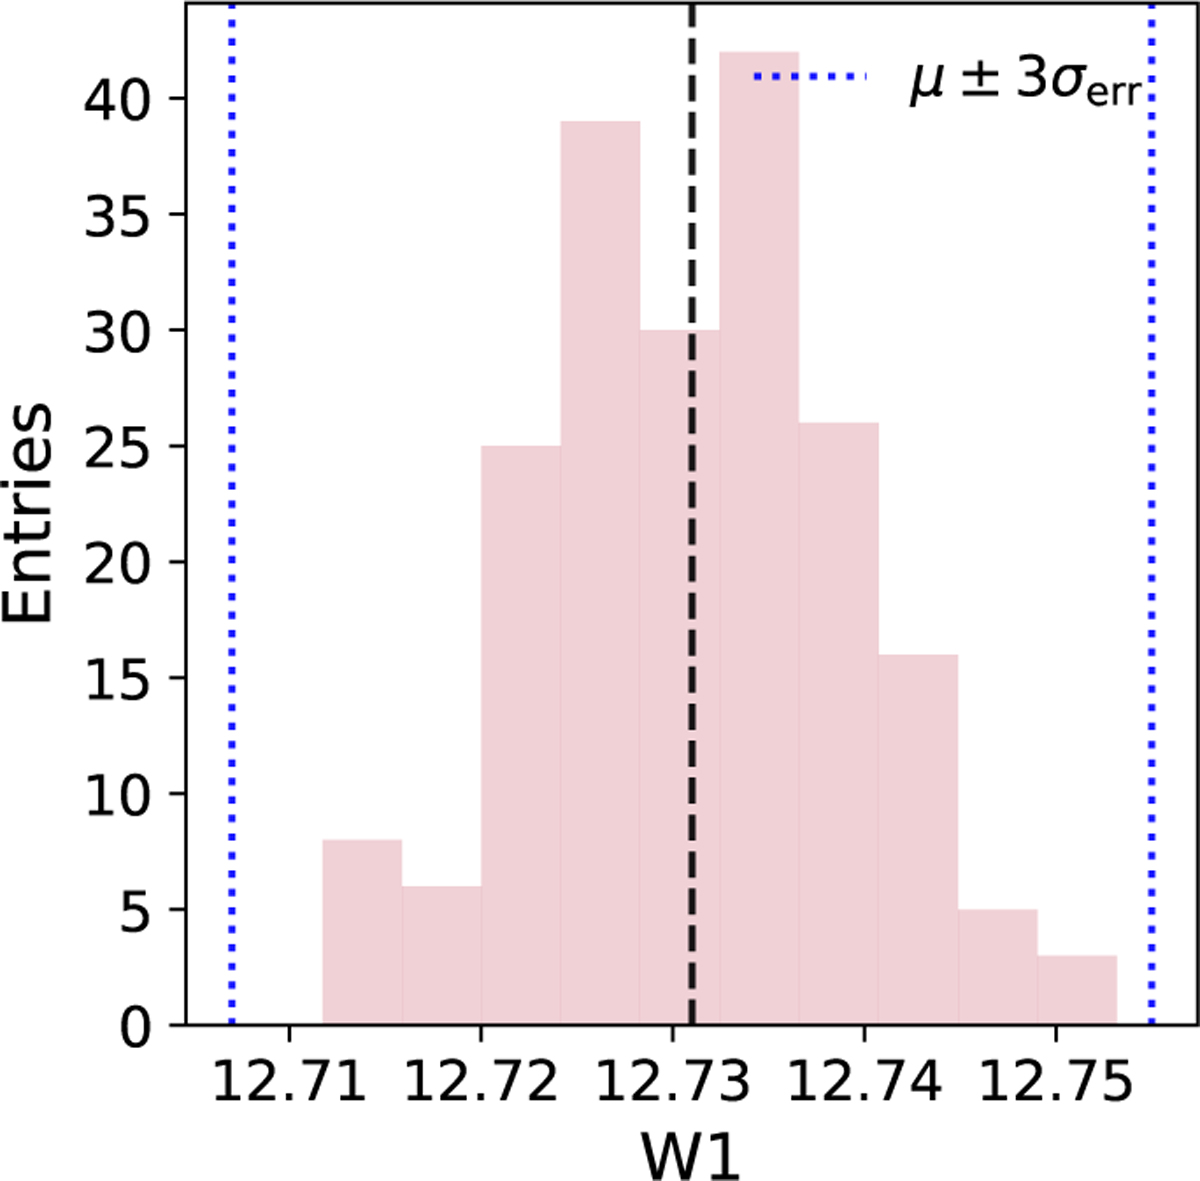
Fig. 5
Download original image
Distribution of W1 input smeared by the measurement uncertainty for a single source. Each point is drawn from a normal distribution centered at the given catalogue input feature μvalue (black dashed line) and extending to ±3σerr. (blue dotted lines), from the given photometric measurement error.
Current usage metrics show cumulative count of Article Views (full-text article views including HTML views, PDF and ePub downloads, according to the available data) and Abstracts Views on Vision4Press platform.
Data correspond to usage on the plateform after 2015. The current usage metrics is available 48-96 hours after online publication and is updated daily on week days.
Initial download of the metrics may take a while.