Fig. 3
Download original image
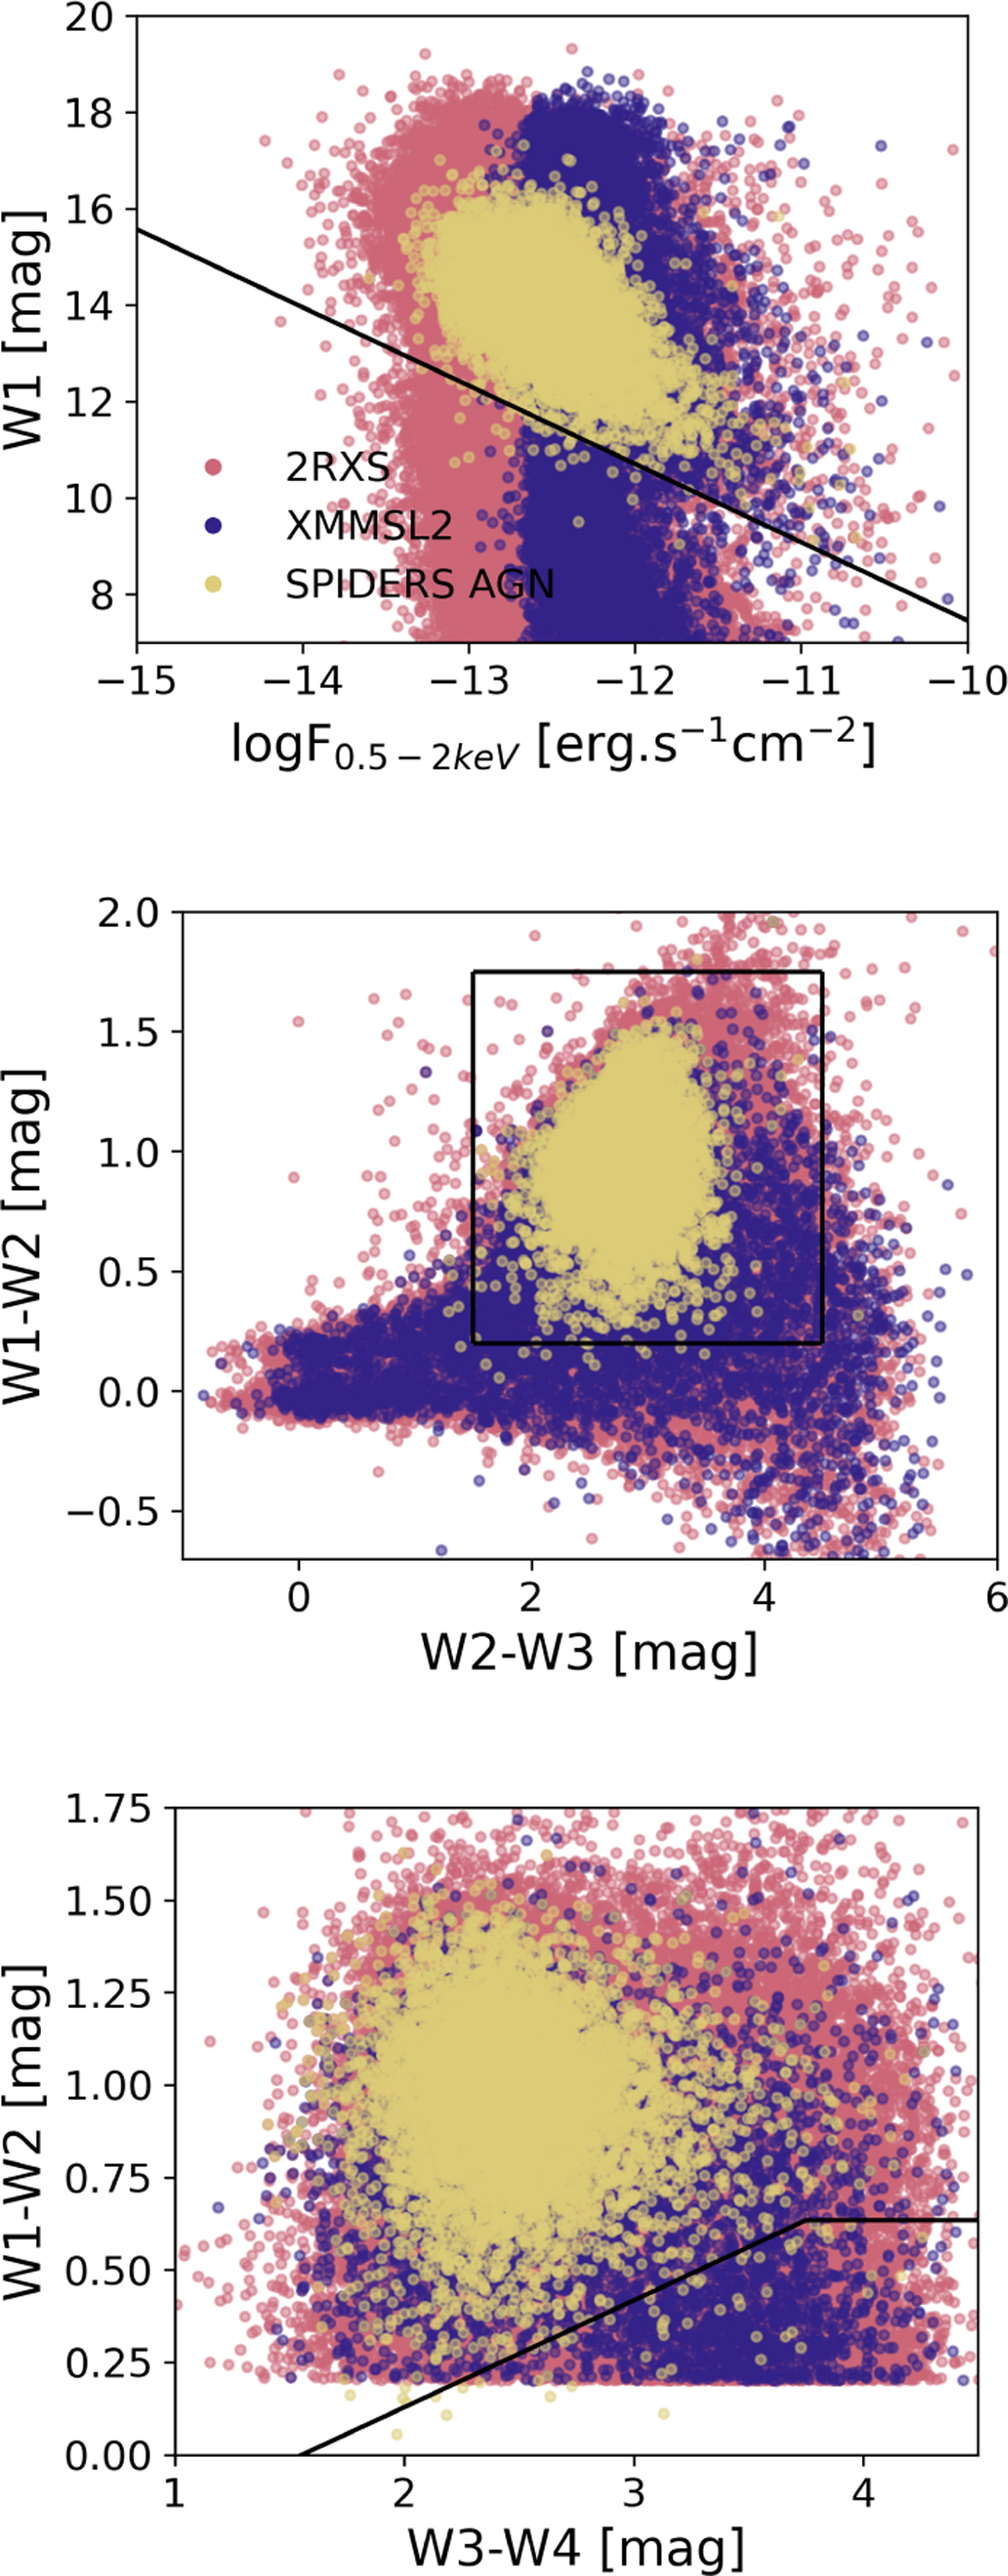
Top: distribution of sources in the W1 band vs. soft X-ray flux parameter space for the ALLWISE counterparts to 2RXS (pink) and XMMSL2 (blue). The confirmed SPIDERS AGN are represented in yellow. The cut defined in Eq. (2) is also shown. W1–W2 magnitude plotted against the W2–W3 (middle) and W3–W4 (bottom). The black lines show the cuts applied based on the SPIDERS AGN position.
Current usage metrics show cumulative count of Article Views (full-text article views including HTML views, PDF and ePub downloads, according to the available data) and Abstracts Views on Vision4Press platform.
Data correspond to usage on the plateform after 2015. The current usage metrics is available 48-96 hours after online publication and is updated daily on week days.
Initial download of the metrics may take a while.