Fig. B.2
Download original image
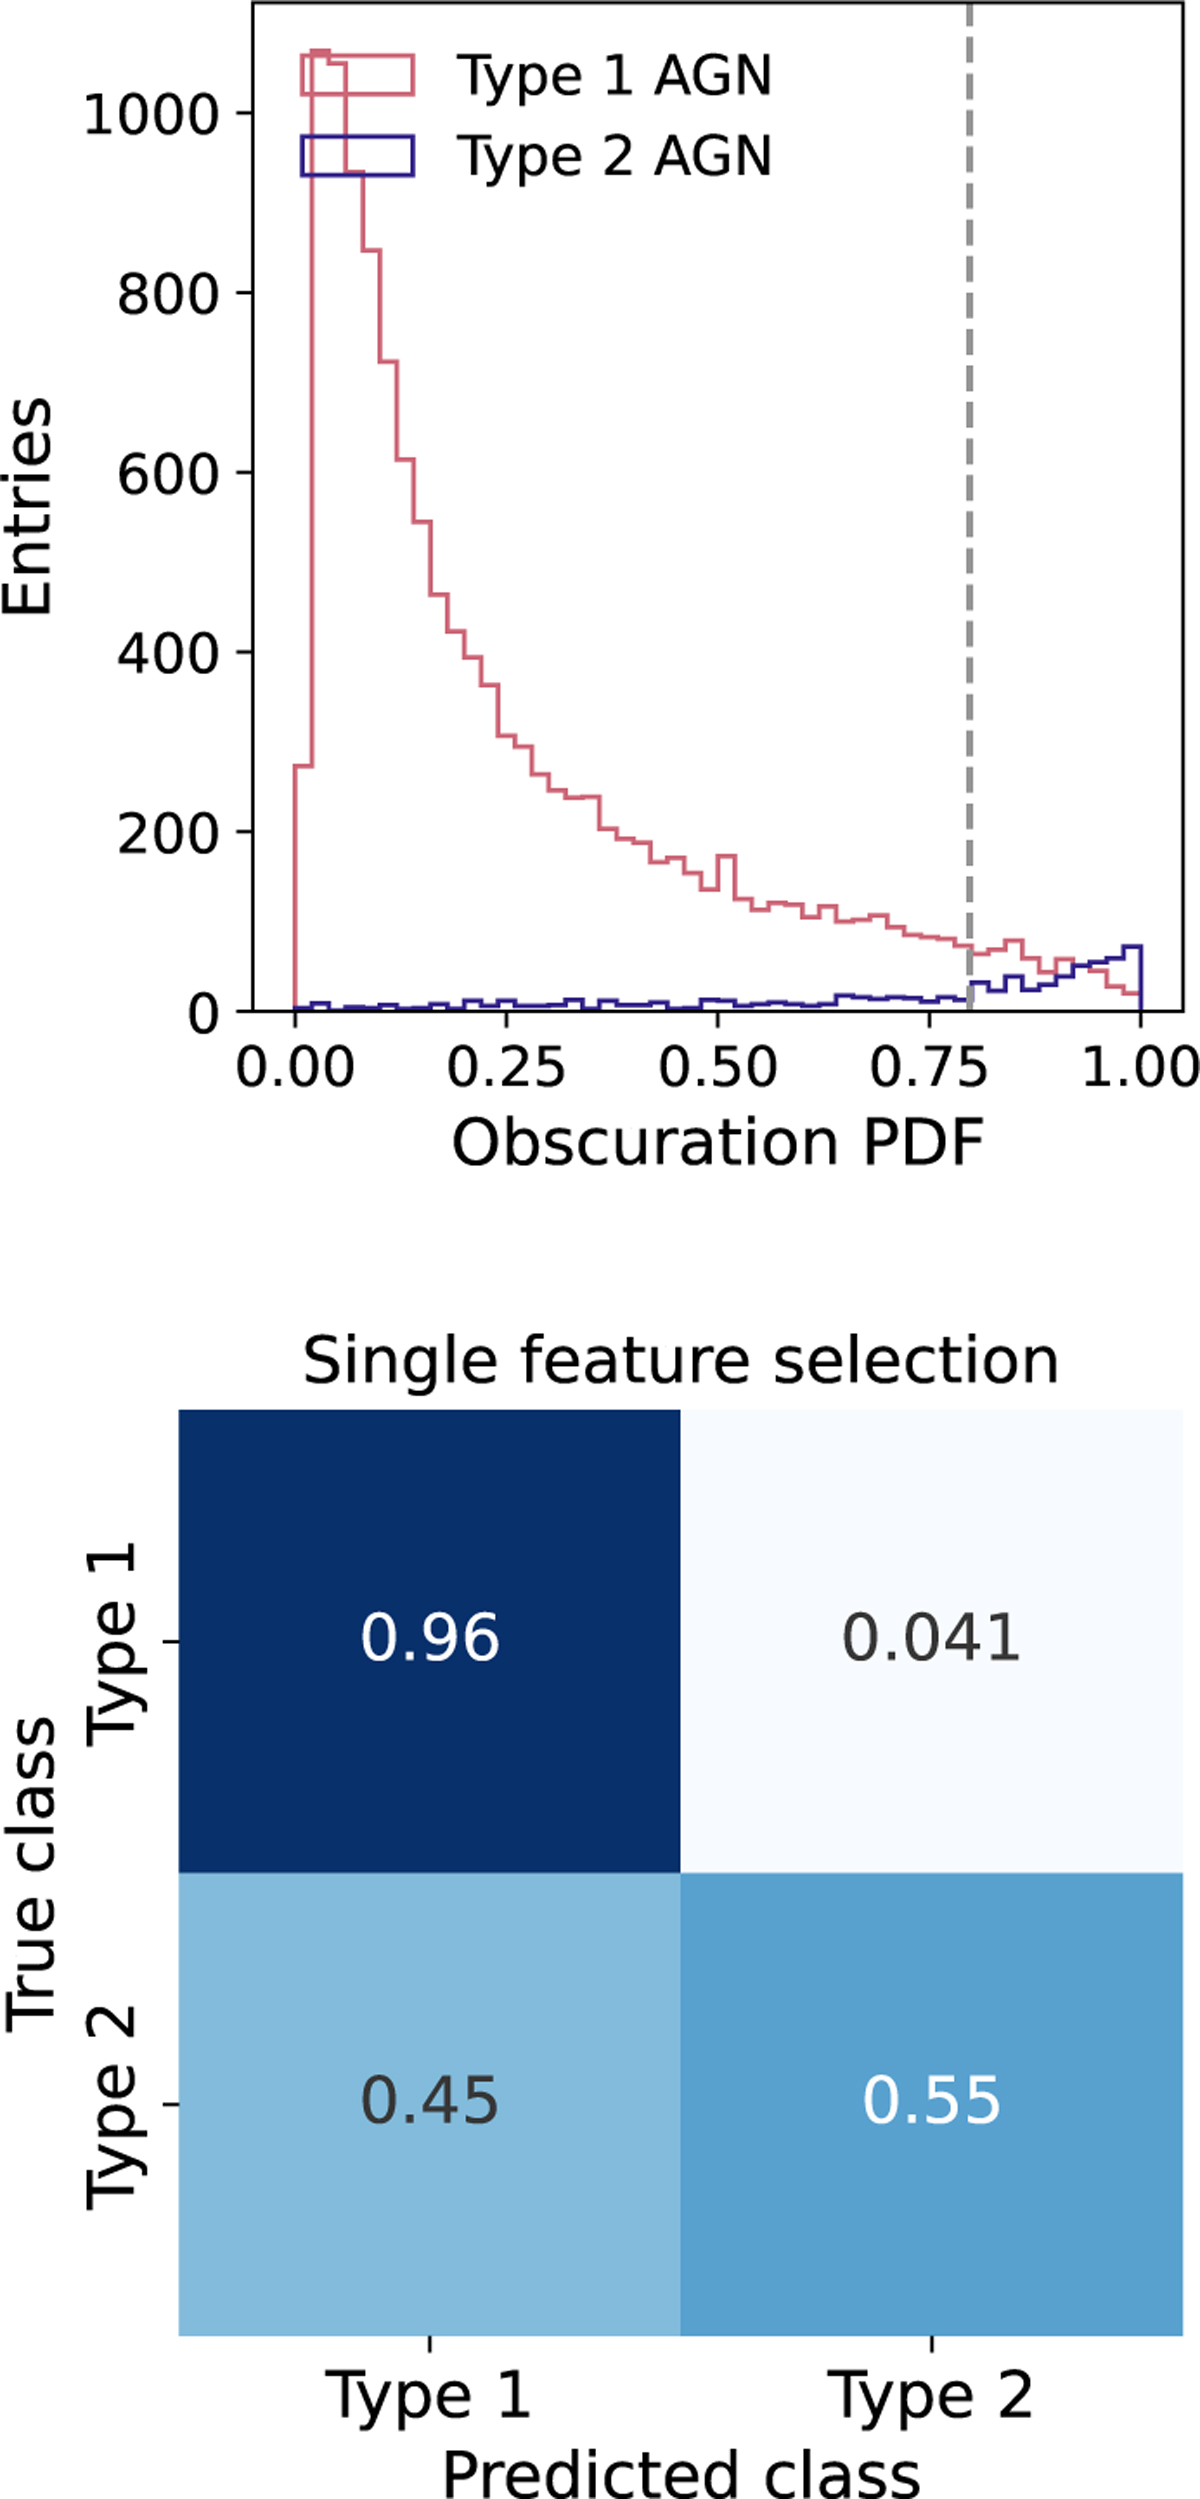
Obscuration PDF precision recall curve definition. (Top) Distribution of SDSS defined Type 1 and 2 AGN as a function of their derived Obscuration PDF. The vertical gray dashed line represents the threshold value giving the optimal classification perfomance. (Bottom) Confusion matrix derived from the left distribution, by scanning through values between 0 and 1 and calculating the precision and recall.
Current usage metrics show cumulative count of Article Views (full-text article views including HTML views, PDF and ePub downloads, according to the available data) and Abstracts Views on Vision4Press platform.
Data correspond to usage on the plateform after 2015. The current usage metrics is available 48-96 hours after online publication and is updated daily on week days.
Initial download of the metrics may take a while.