Open Access
Fig. 21
Download original image
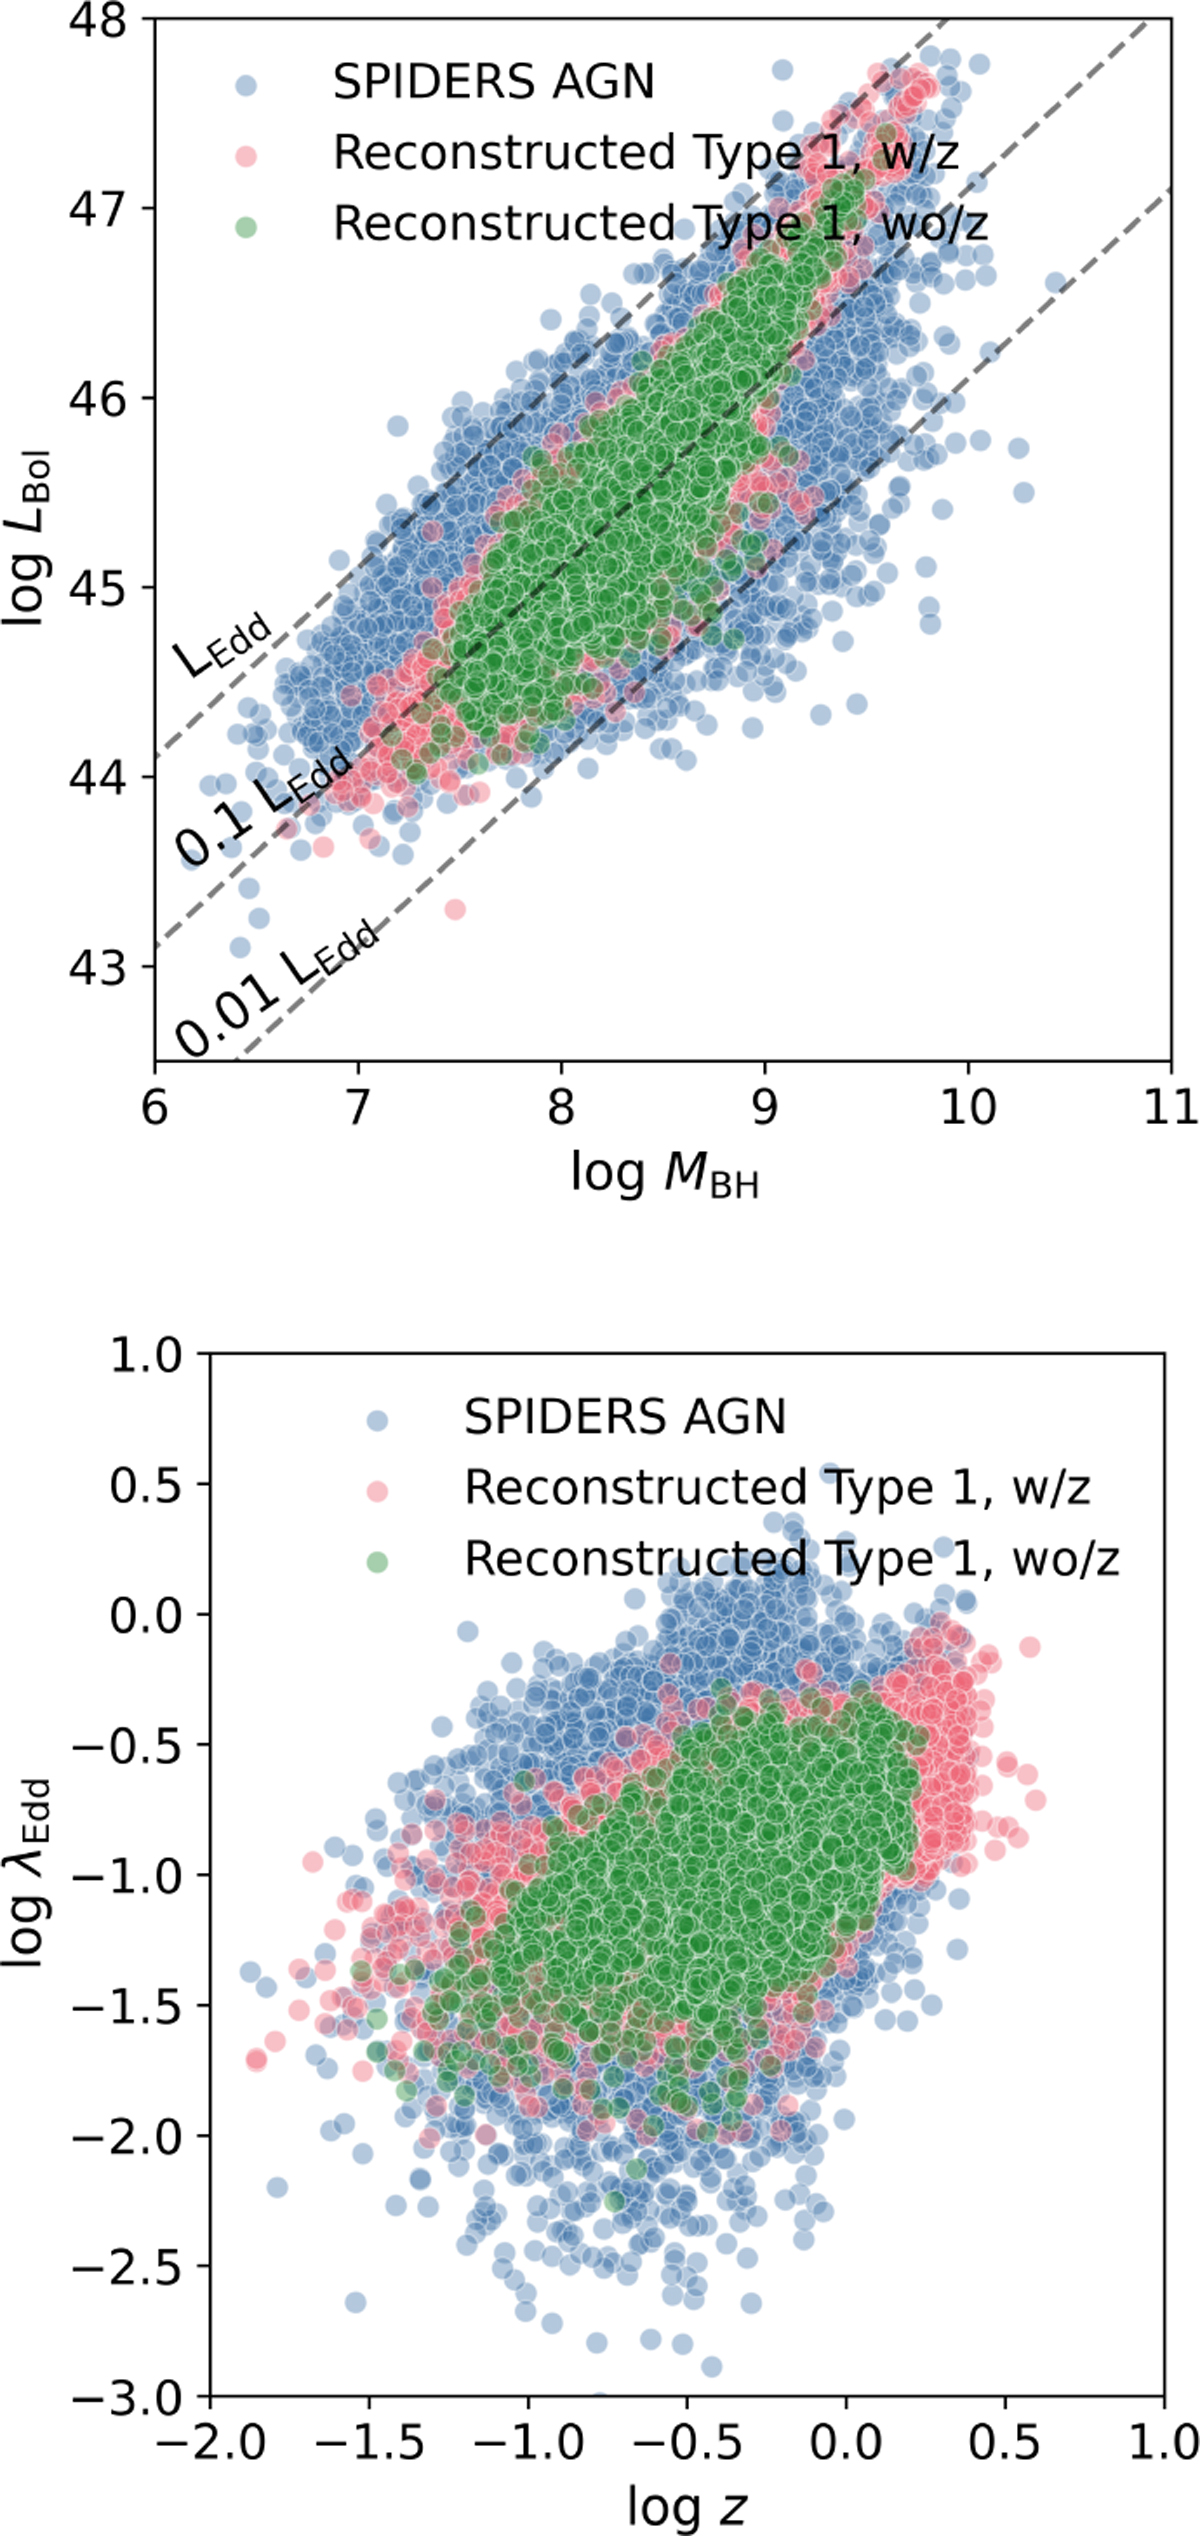
Top: scatter plot of LBol as a function of MBH for the SPIDERS AGN (blue dots), and reconstructed AGN classified as Type 1. AGN with known z measurement are shown in red dots, and those with reconstructed z are represented in green. Bottom: Same three samples for the λEdd vs. z distribution.
Current usage metrics show cumulative count of Article Views (full-text article views including HTML views, PDF and ePub downloads, according to the available data) and Abstracts Views on Vision4Press platform.
Data correspond to usage on the plateform after 2015. The current usage metrics is available 48-96 hours after online publication and is updated daily on week days.
Initial download of the metrics may take a while.