Fig. 18
Download original image
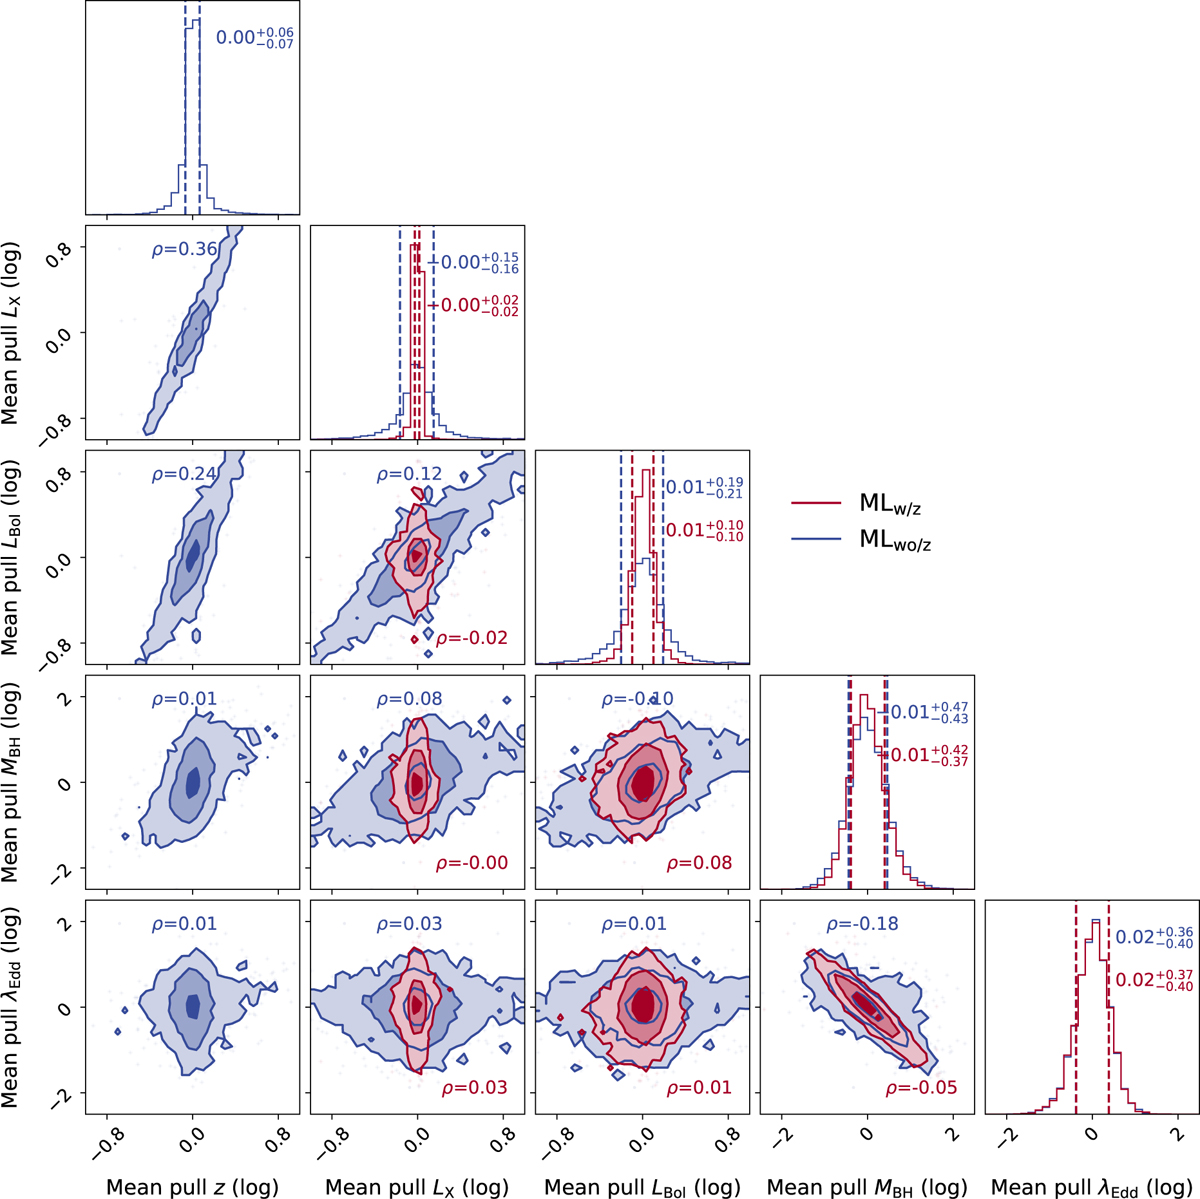
Correlation between pull values for all parameters for MLw/z (red) and MLwo/z (blue). The quality of reconstruction, represented by the mean pull value, is more correlated between the variables in MLwo/z than it is for MLw/z. The vertical dashed lines in the histograms indicate the 0.16 and 0.84 quantites of the distributions, and the numbers show the respective medians and 0.16 and 0.84 quantites.
Current usage metrics show cumulative count of Article Views (full-text article views including HTML views, PDF and ePub downloads, according to the available data) and Abstracts Views on Vision4Press platform.
Data correspond to usage on the plateform after 2015. The current usage metrics is available 48-96 hours after online publication and is updated daily on week days.
Initial download of the metrics may take a while.