Fig. 14
Download original image
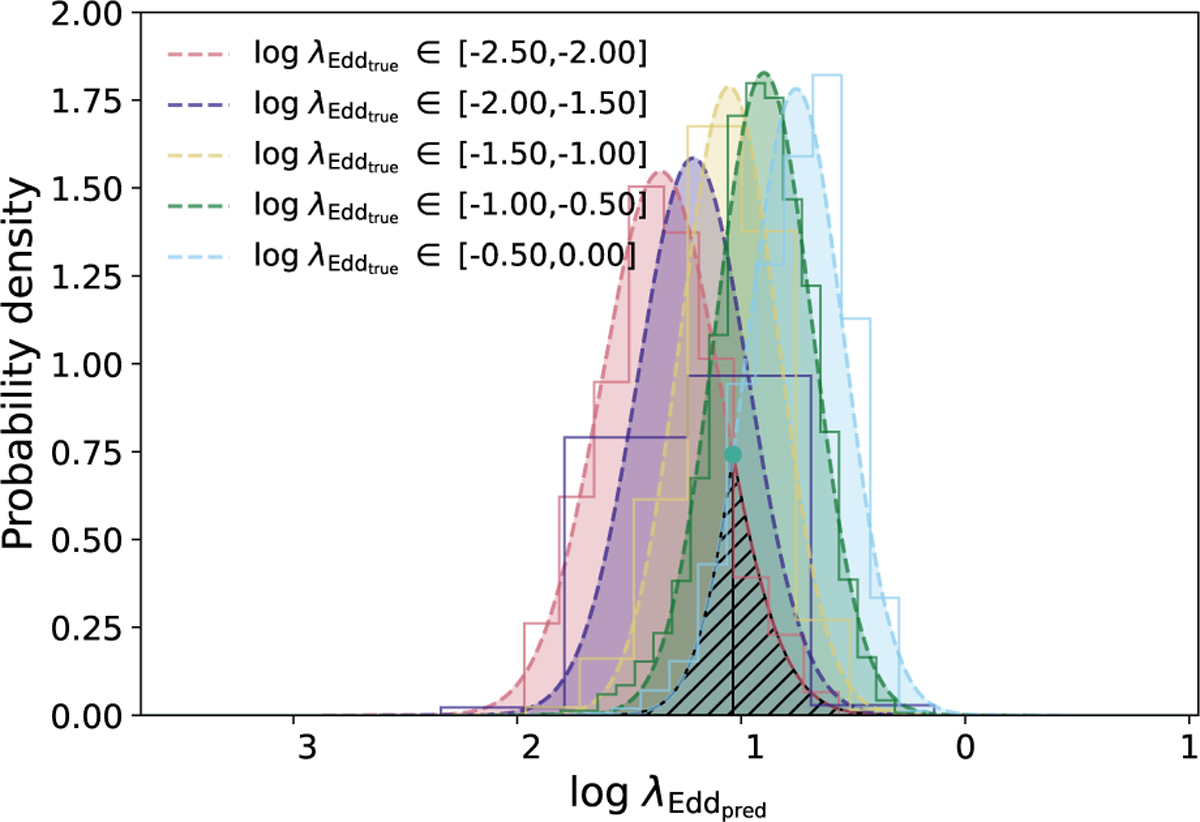
Distributions of ![]() for various bins in
for various bins in ![]() , in log space. Gaussian PDFs are fitted and shown over their respective histograms. The hatched area corresponds to the contamination between the lowest and highest range PDFs: the values quoted in Table 5 were calculated by dividing the overlapping (hatched area) with the integral of the highest range PDF.
, in log space. Gaussian PDFs are fitted and shown over their respective histograms. The hatched area corresponds to the contamination between the lowest and highest range PDFs: the values quoted in Table 5 were calculated by dividing the overlapping (hatched area) with the integral of the highest range PDF.
Current usage metrics show cumulative count of Article Views (full-text article views including HTML views, PDF and ePub downloads, according to the available data) and Abstracts Views on Vision4Press platform.
Data correspond to usage on the plateform after 2015. The current usage metrics is available 48-96 hours after online publication and is updated daily on week days.
Initial download of the metrics may take a while.