Fig. 13
Download original image
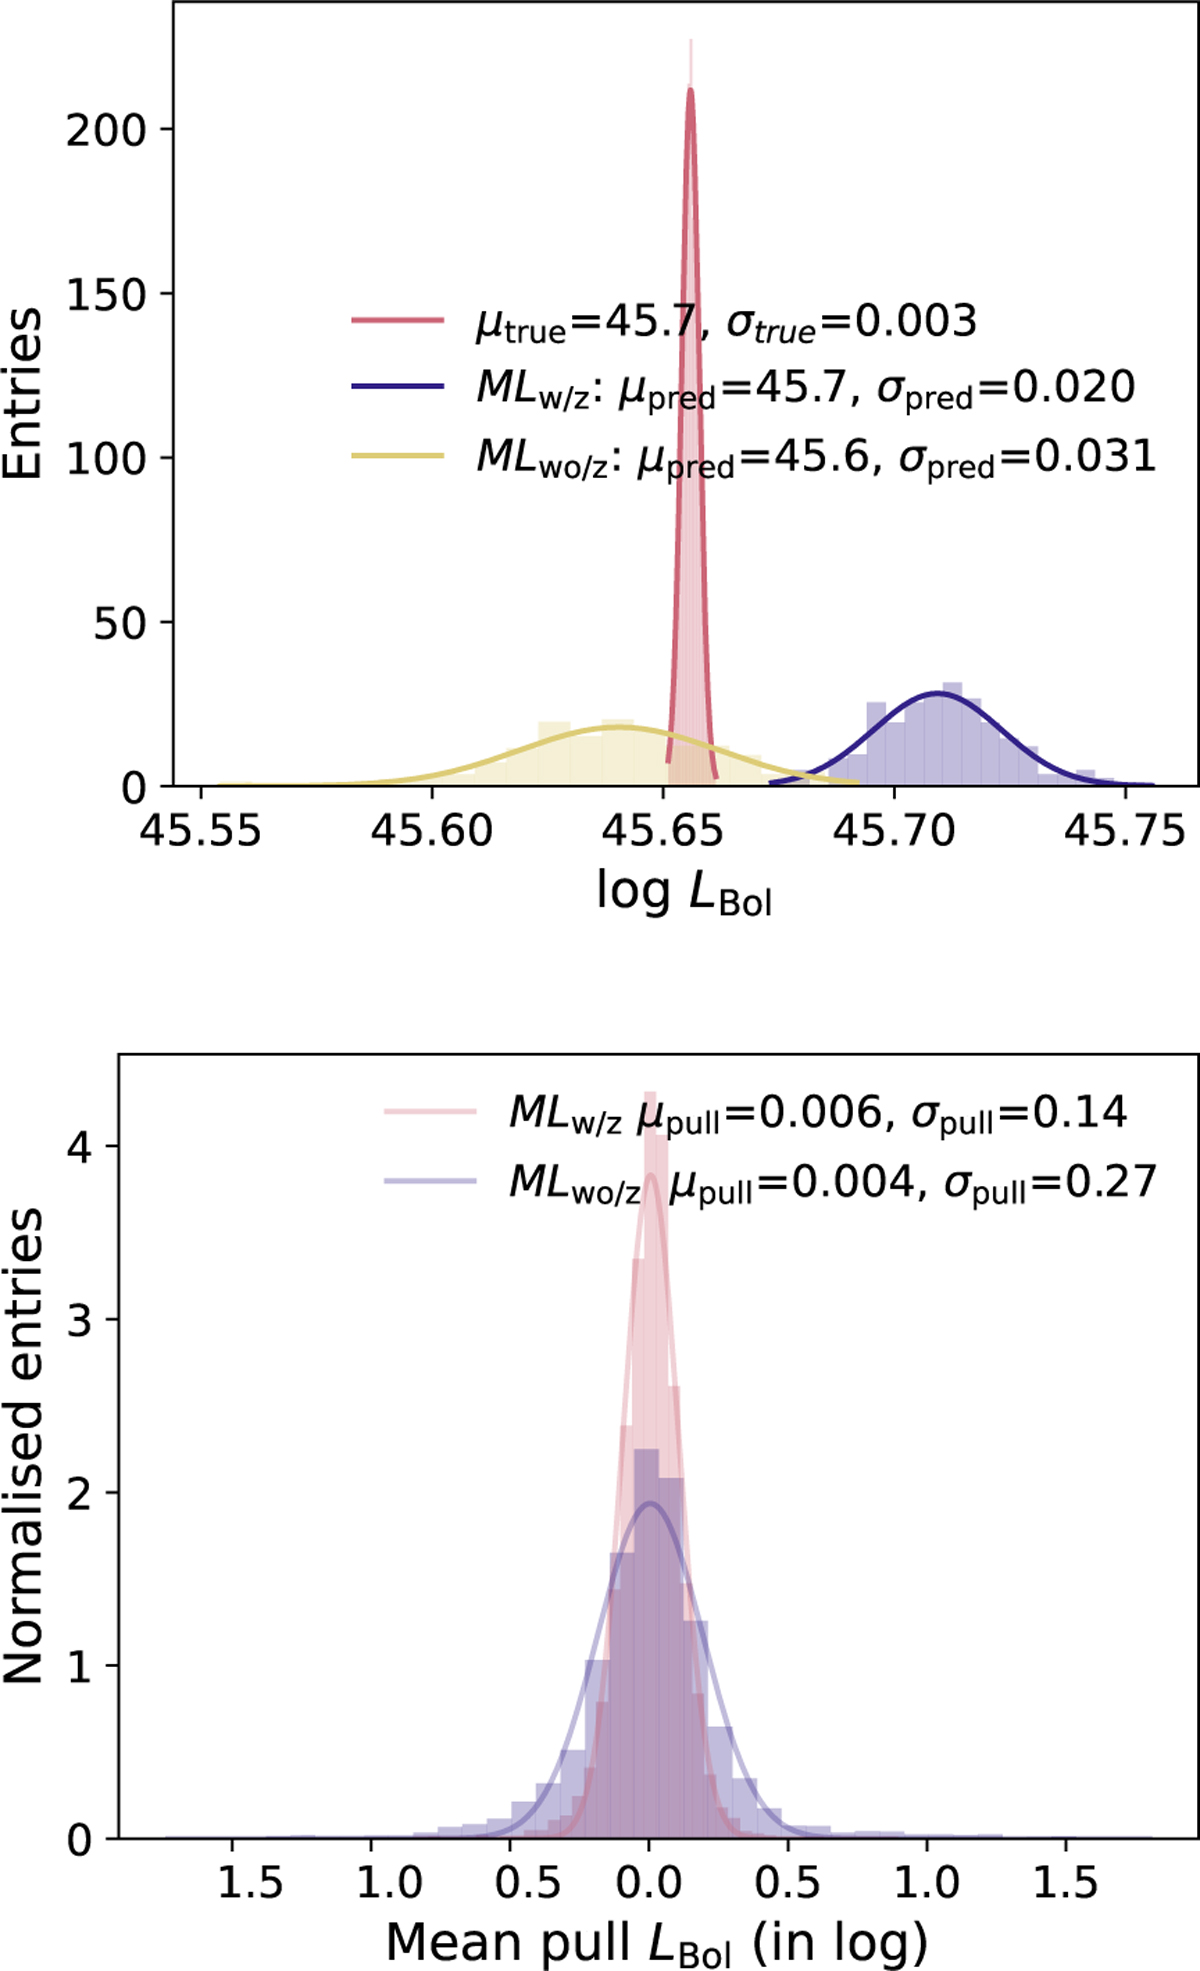
Top: true (red), and predicted distributions reconstructed Ν times with MLw/z (purple) and MLwo/z (yellow) of the bolometric luminosity for a training source. The true value is represented by a normal distribution by taking into account the measurement error σtrue and assuming it to be gaussian. Bottom: mean pull distribution for the LBo] for all training sources, taking all μtrue – μpred values for MLw/z (red) and MLwo/z (purple).
Current usage metrics show cumulative count of Article Views (full-text article views including HTML views, PDF and ePub downloads, according to the available data) and Abstracts Views on Vision4Press platform.
Data correspond to usage on the plateform after 2015. The current usage metrics is available 48-96 hours after online publication and is updated daily on week days.
Initial download of the metrics may take a while.