Open Access
Fig. 11
Download original image
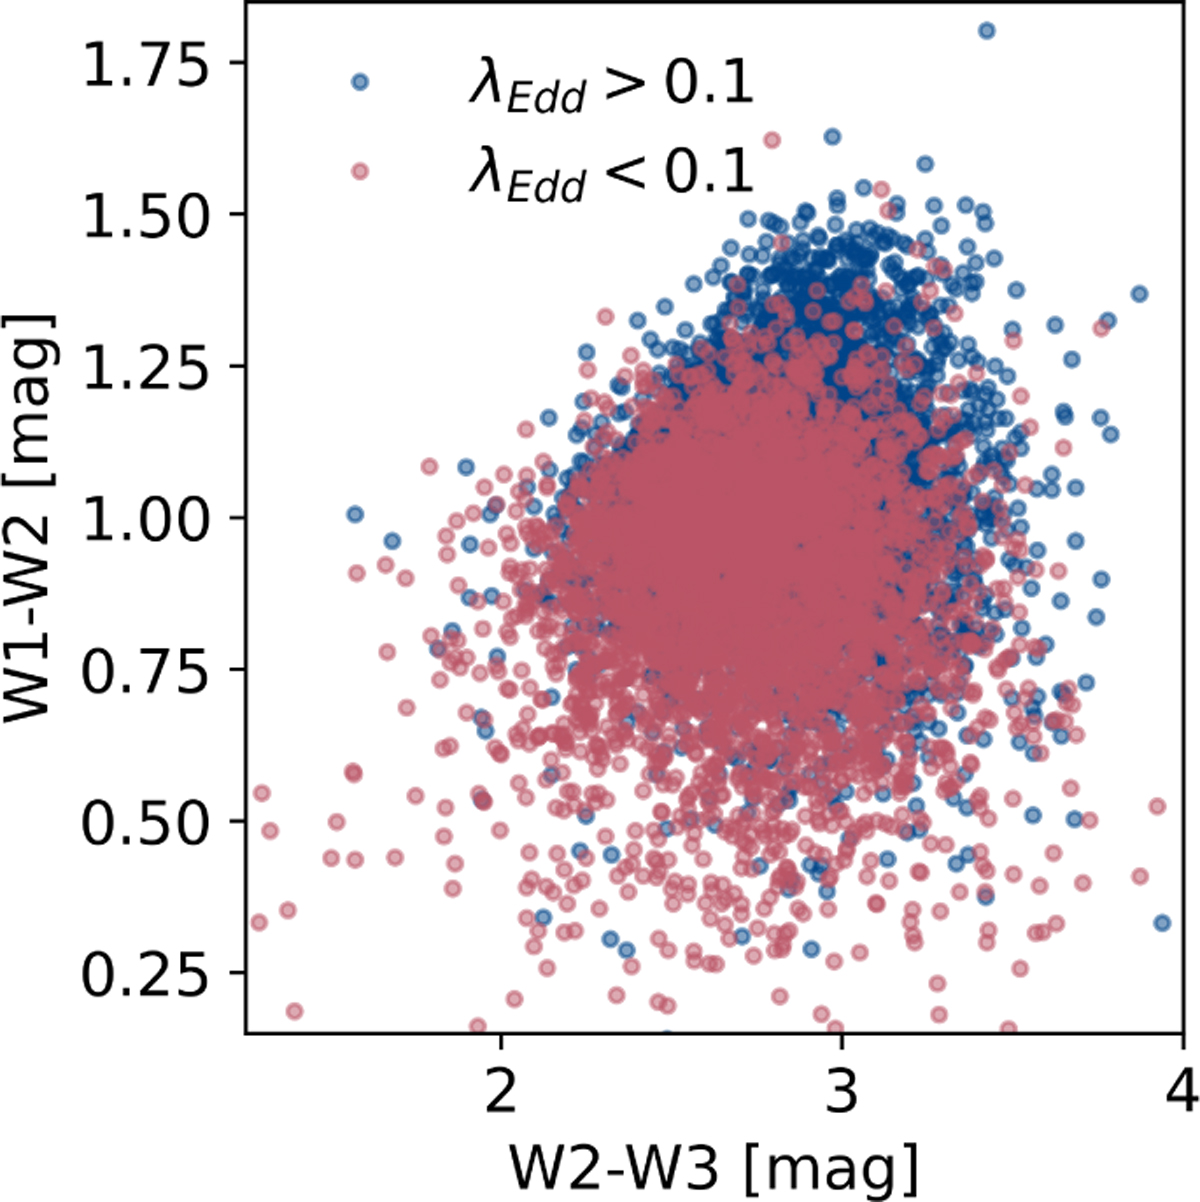
W1–W2 magnitudes as a function of W2–W3 magnitudes for sources in the training sample with low (red dots) and high (blue dots) λEdd, The low and high samples are separated by the median value of the λEdd distribution, 0.1.
Current usage metrics show cumulative count of Article Views (full-text article views including HTML views, PDF and ePub downloads, according to the available data) and Abstracts Views on Vision4Press platform.
Data correspond to usage on the plateform after 2015. The current usage metrics is available 48-96 hours after online publication and is updated daily on week days.
Initial download of the metrics may take a while.