Fig. 10
Download original image
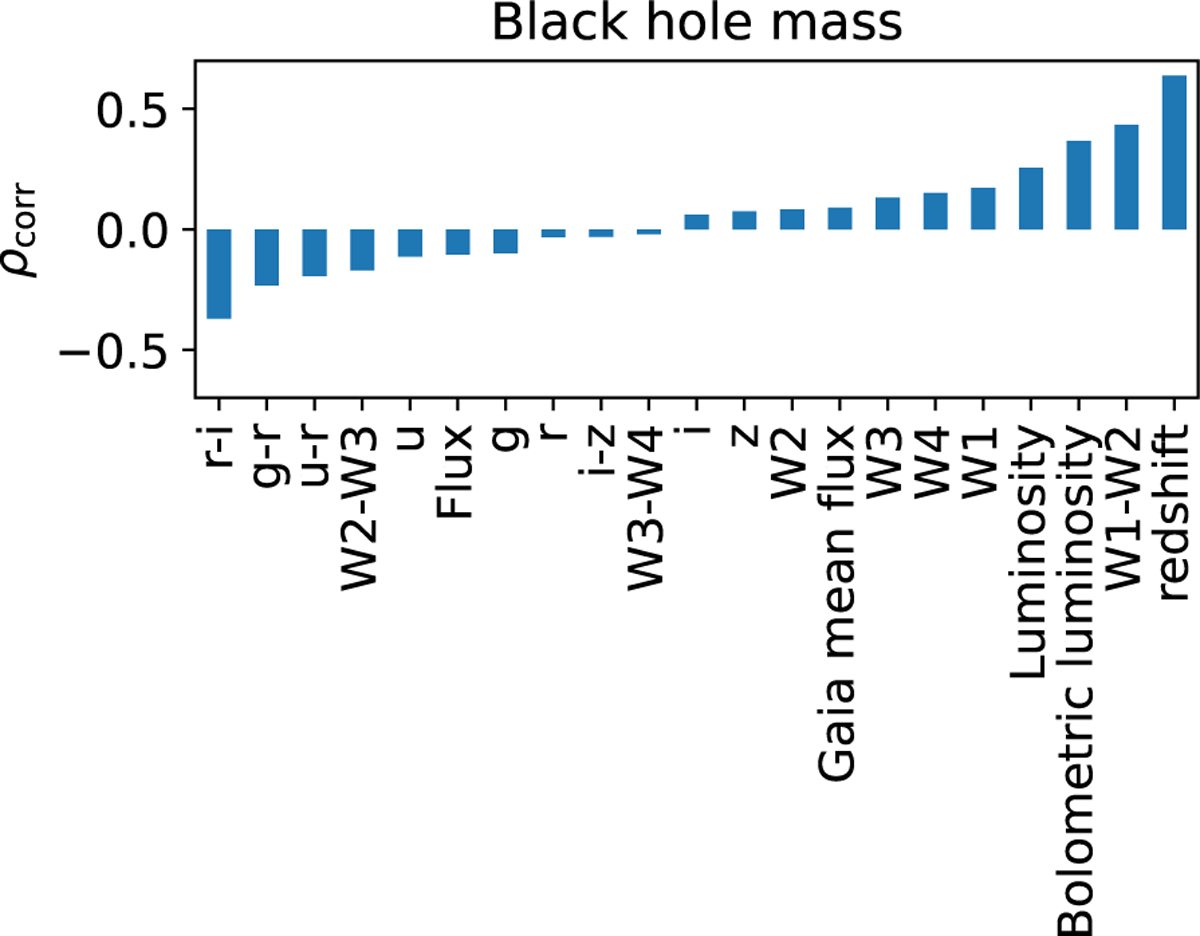
Bar chart showing the Pearson correlation score of input variables and the black hole mass, from the training sample data. The redshift, luminosity, and bolometric luminosity correlations are included in this chart, since z (and thus LX) are known for almost half of the sources, and the outputs will be predicted before the black hole mass, underlining the logic behind the chain regression.
Current usage metrics show cumulative count of Article Views (full-text article views including HTML views, PDF and ePub downloads, according to the available data) and Abstracts Views on Vision4Press platform.
Data correspond to usage on the plateform after 2015. The current usage metrics is available 48-96 hours after online publication and is updated daily on week days.
Initial download of the metrics may take a while.