Fig. 8
Download original image
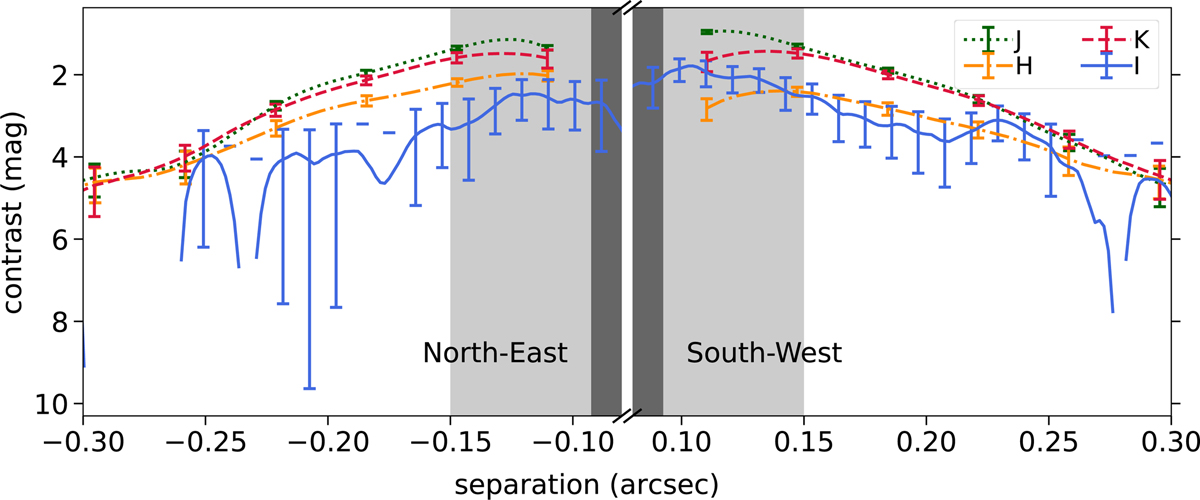
Radial contrast profiles of the CS Cha multi-band observations along the major axis. The contrast is calculated relative to the total intensity of the central star. The filter band is indicated by line style and color. The region covered by the utilized coronagraphs is shaded dark gray, while the region where coronagraph suppression is still significant is shaded light gray. The ZIMPOL coronagraph is smaller than the IRDIS coronagraph, and that the I-band data can be traced farther in. Due to the noisy nature of the R-band data, they are excluded here.
Current usage metrics show cumulative count of Article Views (full-text article views including HTML views, PDF and ePub downloads, according to the available data) and Abstracts Views on Vision4Press platform.
Data correspond to usage on the plateform after 2015. The current usage metrics is available 48-96 hours after online publication and is updated daily on week days.
Initial download of the metrics may take a while.