Fig. 6
Download original image
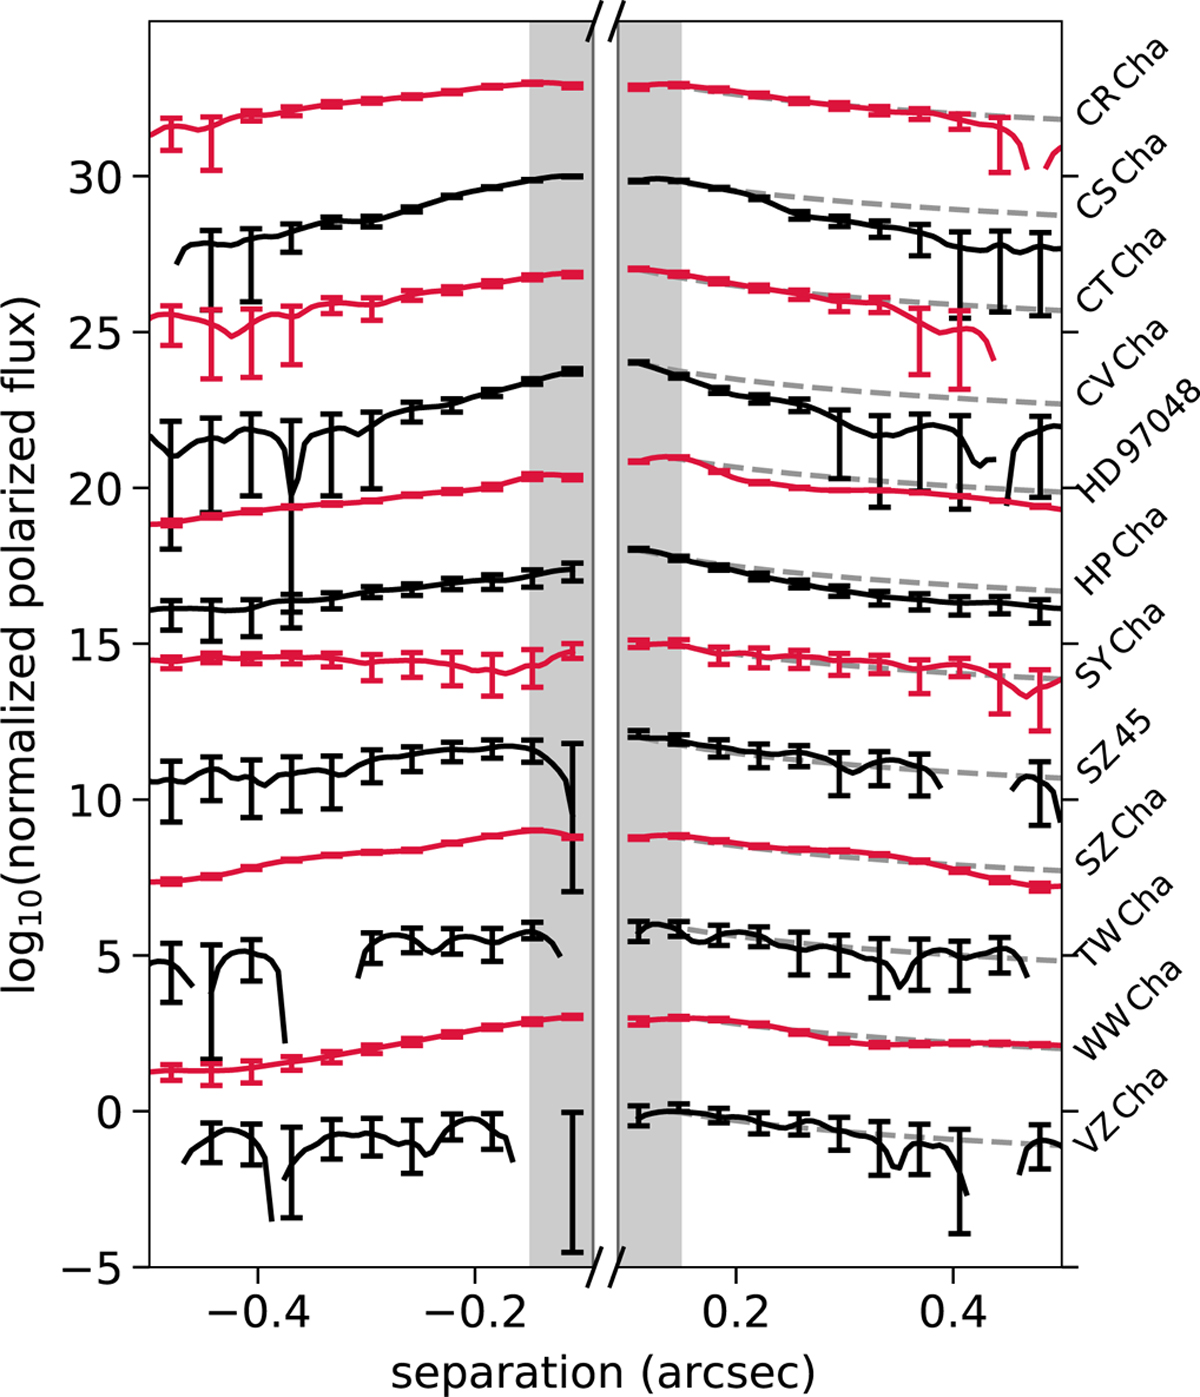
Radial profiles of all detected disks along the major axis. The polarized flux is in all cases normalized to unity and then displayed on a logarithmic scale. The profiles of individual disks have been vertically offset from each other for better readability by 3 units of the y-axis (starting with an offset of 0 for VZ Cha). For the same reason the individual profiles are alternated in red and black. The region directly covered by the IRDIS coronagraph is excluded from the plot, while the region that is still influenced by coronagraph suppression is shaded light gray. Gray dashed lines are added on the right side of the plot to indicate a r−2 drop-off, expected from a scattered light signal.
Current usage metrics show cumulative count of Article Views (full-text article views including HTML views, PDF and ePub downloads, according to the available data) and Abstracts Views on Vision4Press platform.
Data correspond to usage on the plateform after 2015. The current usage metrics is available 48-96 hours after online publication and is updated daily on week days.
Initial download of the metrics may take a while.