Fig. 3
Download original image
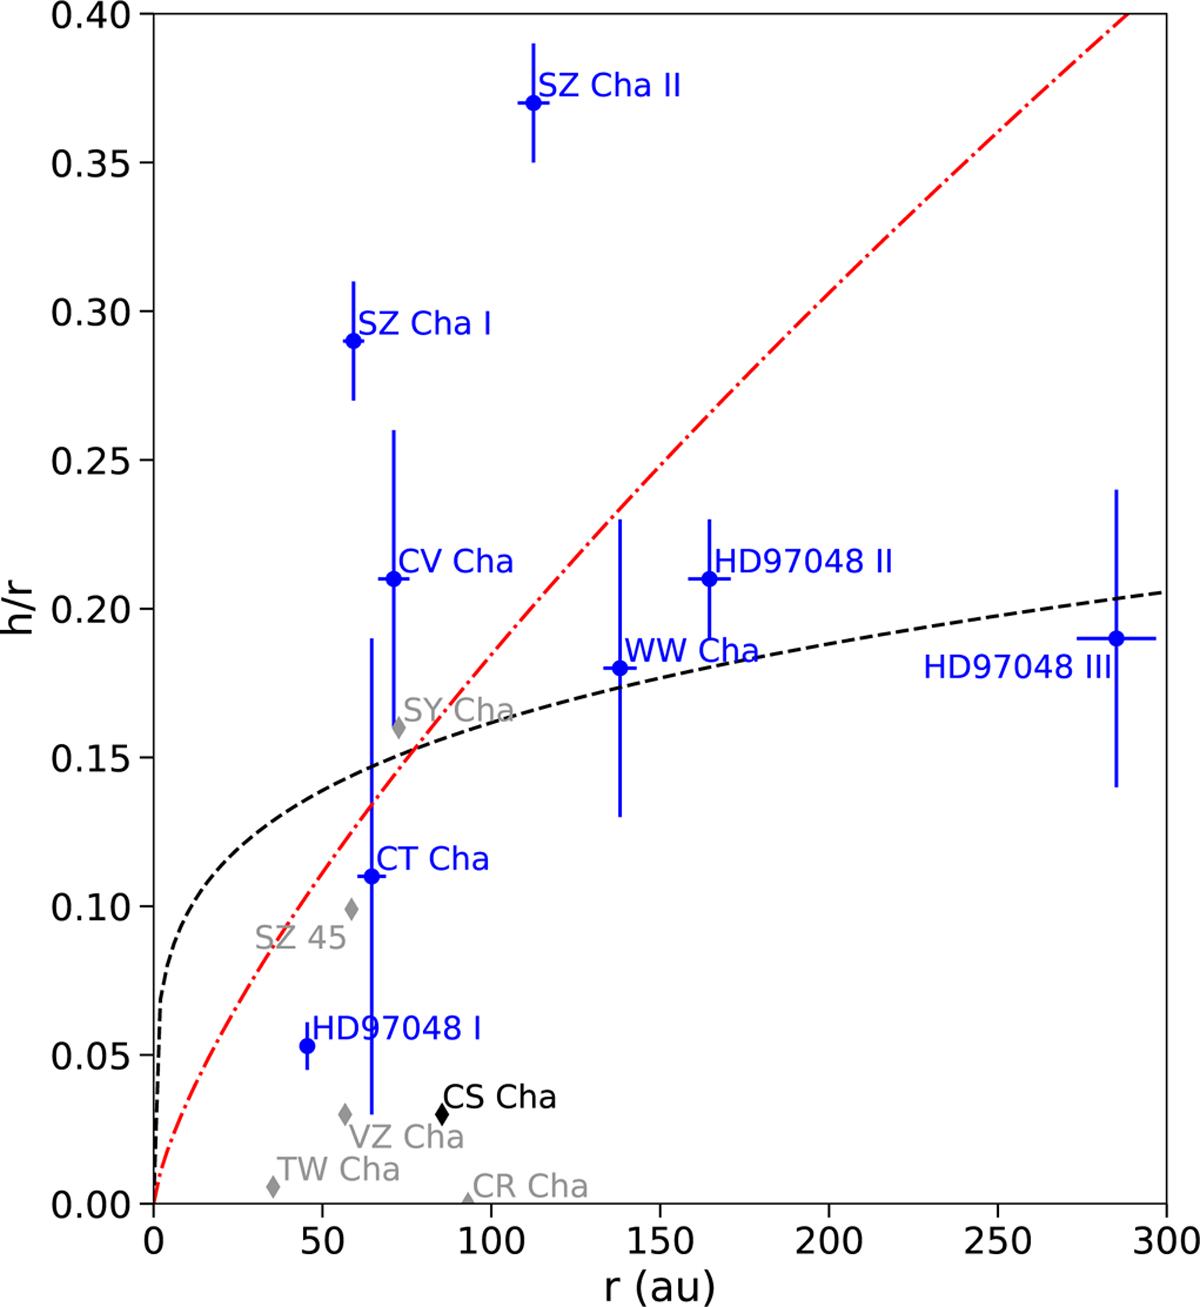
Aspect ratio for all disks with at least one measured surface height. The black dashed line is the fit to several Τ Tauri stars done by Avenhaus et al. (2018), while the red dash-dotted line is the fit to the SPHERE J-band data of HD 97048 from Ginski et al. (2016). Data points in gray and black have intrinsically very large uncertainties (not displayed, but shown in Table 3).
Current usage metrics show cumulative count of Article Views (full-text article views including HTML views, PDF and ePub downloads, according to the available data) and Abstracts Views on Vision4Press platform.
Data correspond to usage on the plateform after 2015. The current usage metrics is available 48-96 hours after online publication and is updated daily on week days.
Initial download of the metrics may take a while.