Fig. B.4
Download original image
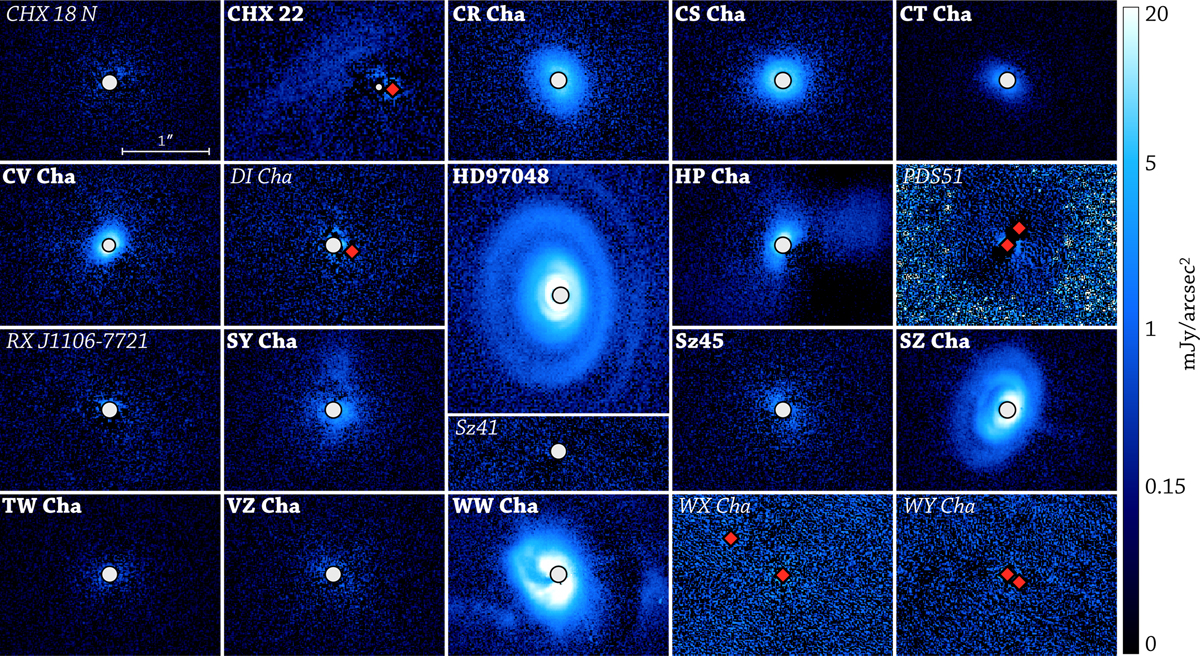
Imagery of the sample. The Qϕ image of all targets is shown at the same logarithmic, flux scale, and physical scale (as indicated in the first panel). Detections are indicated by a name in bold, nondetections in italics. The gray circles mark the size of the coronagraphic mask, while the red diamonds give the position of any unmasked star (both primary in noncoronagraphic observations and companions).
Current usage metrics show cumulative count of Article Views (full-text article views including HTML views, PDF and ePub downloads, according to the available data) and Abstracts Views on Vision4Press platform.
Data correspond to usage on the plateform after 2015. The current usage metrics is available 48-96 hours after online publication and is updated daily on week days.
Initial download of the metrics may take a while.