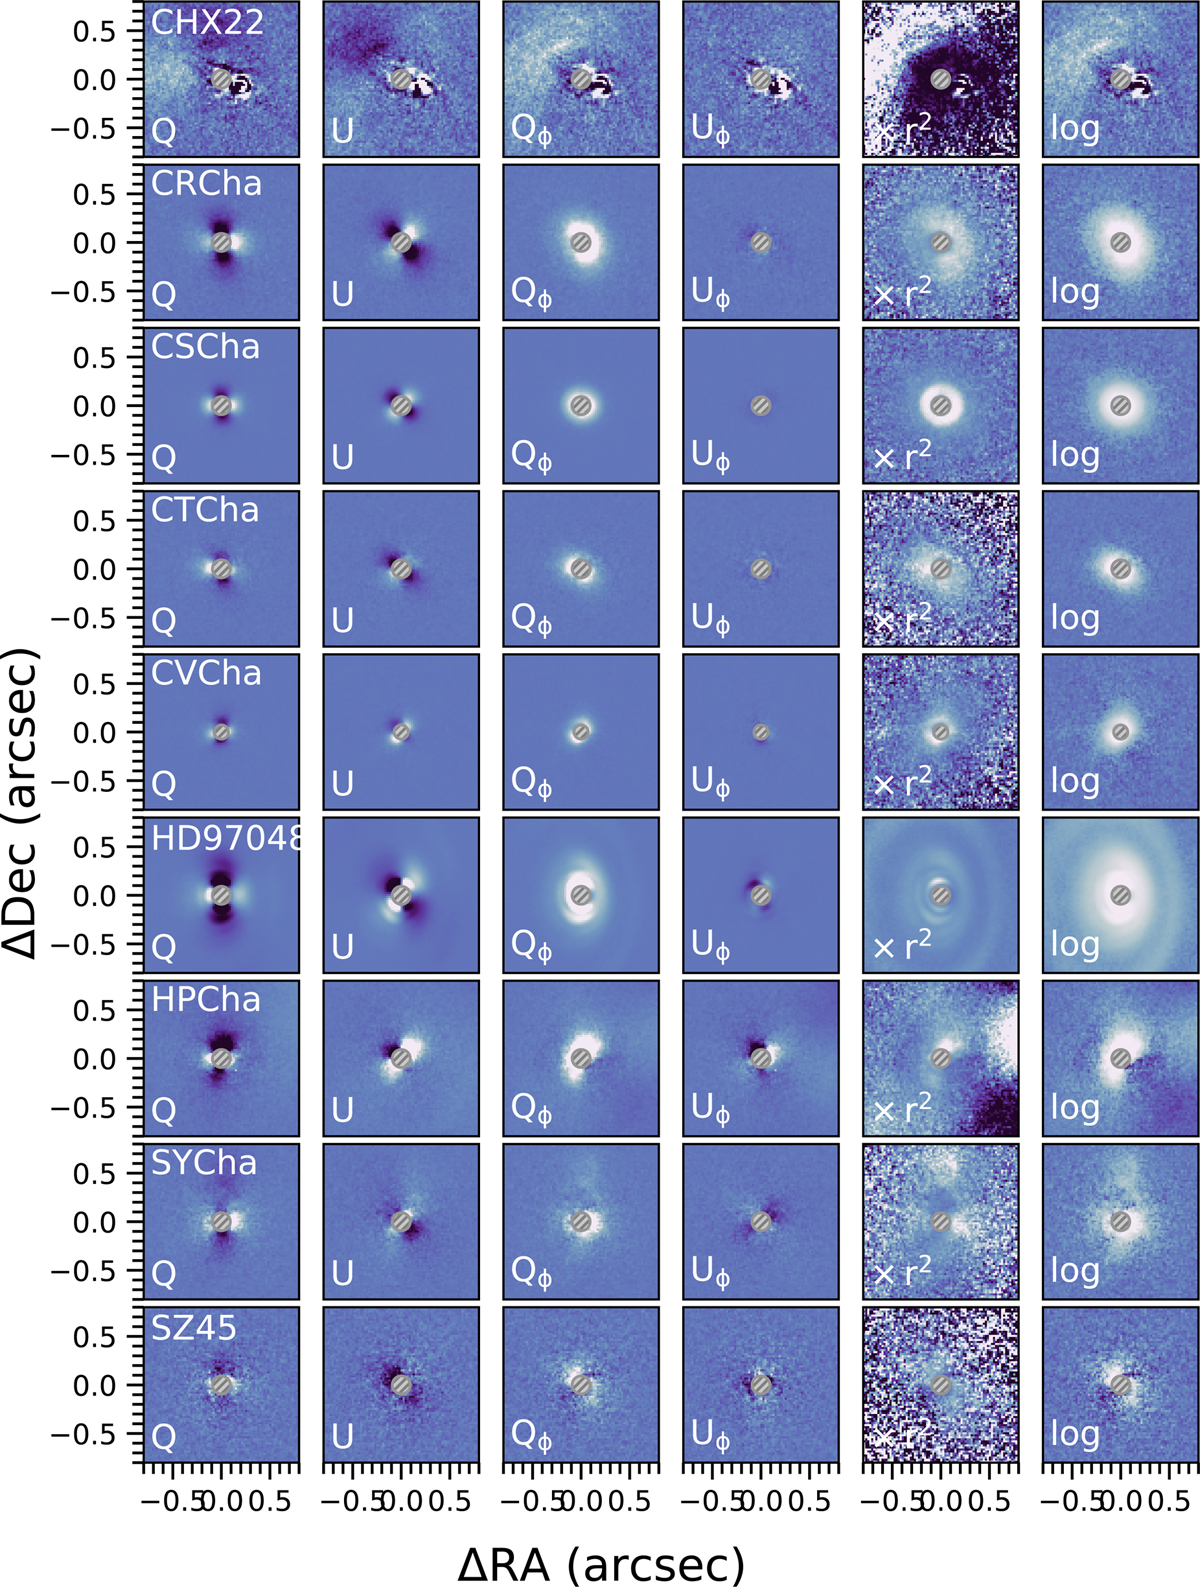
Fig. B.1
Download original image
All coronagraphic images of our target sample. The color scale is linear in all images with the same cuts in each row, but different cuts for different sources. The color scale is symmetric around 0. The gray hashed circles show the coronagraph size and position. The Stokes Q and U images are in the first two columns and the derived Qϕ and Uϕ images in columns 3 and 4. In column 5 is shown the Qϕ image corrected for the separation-dependent drop-off in illumination (taking into account the system inclination). In the last column, the Qϕ image is shown on a log scale to highlight the fainter parts of the disks.
Current usage metrics show cumulative count of Article Views (full-text article views including HTML views, PDF and ePub downloads, according to the available data) and Abstracts Views on Vision4Press platform.
Data correspond to usage on the plateform after 2015. The current usage metrics is available 48-96 hours after online publication and is updated daily on week days.
Initial download of the metrics may take a while.