Fig. 5
Download original image
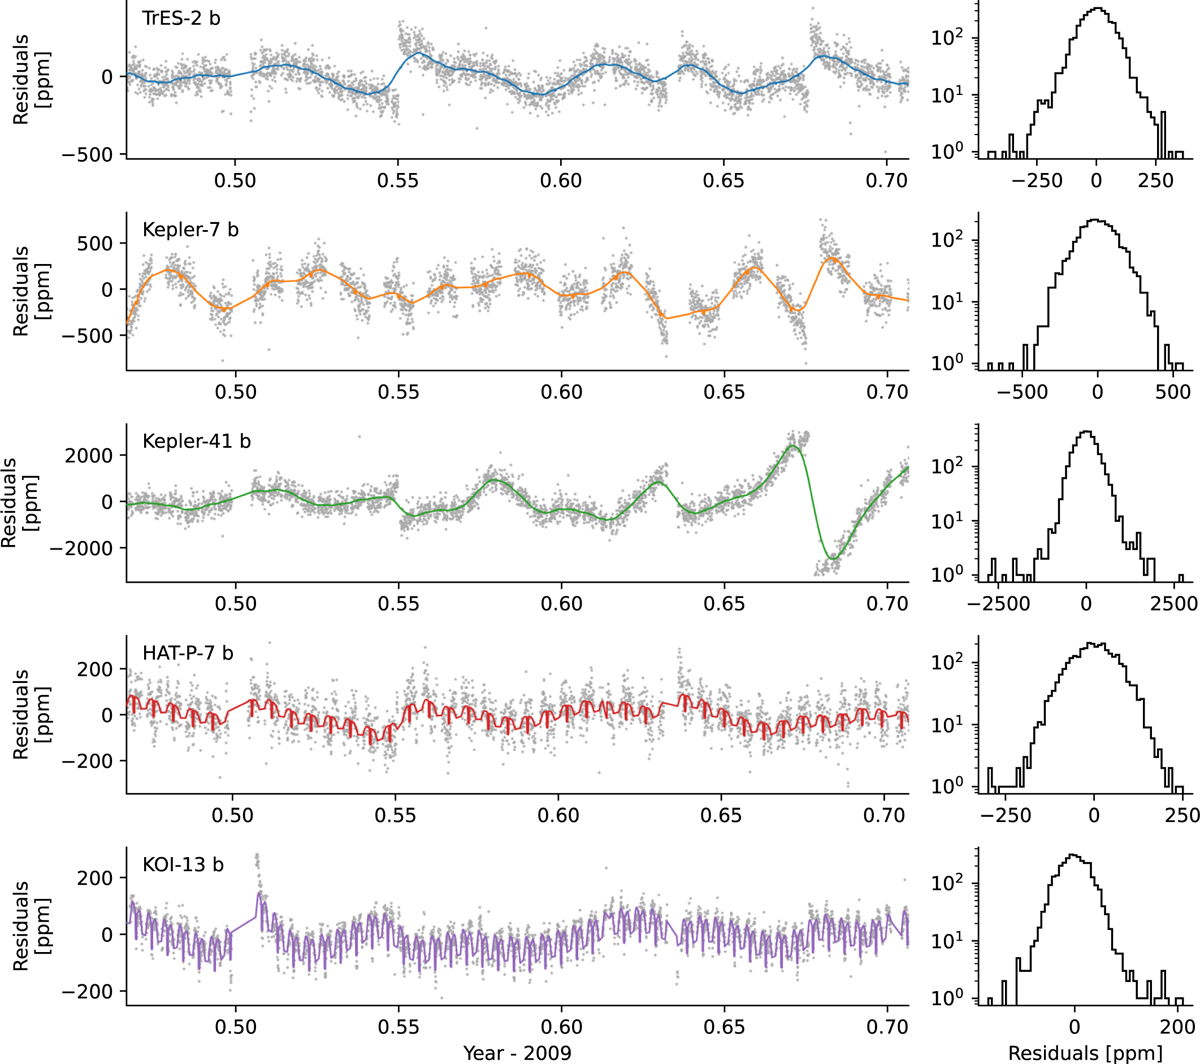
Kepler SAP fluxes (gray points) after CBV corrections were applied, in relative flux units of ppm, for Quarter 2 (roughly 6% of each dataset). The composite fit (red curve) contains components including planetary phase curve (reflected light and thermal emission), strictly periodic stellar artifacts (ellipsoidal variations, Doppler beaming), and a Gaussian process for stochastic stellar artifacts such as magnetic activity (via a Gaussian process). The fit to the light curves on the left produces residuals which are shown in the histogram on the right.
Current usage metrics show cumulative count of Article Views (full-text article views including HTML views, PDF and ePub downloads, according to the available data) and Abstracts Views on Vision4Press platform.
Data correspond to usage on the plateform after 2015. The current usage metrics is available 48-96 hours after online publication and is updated daily on week days.
Initial download of the metrics may take a while.