Fig. 3
Download original image
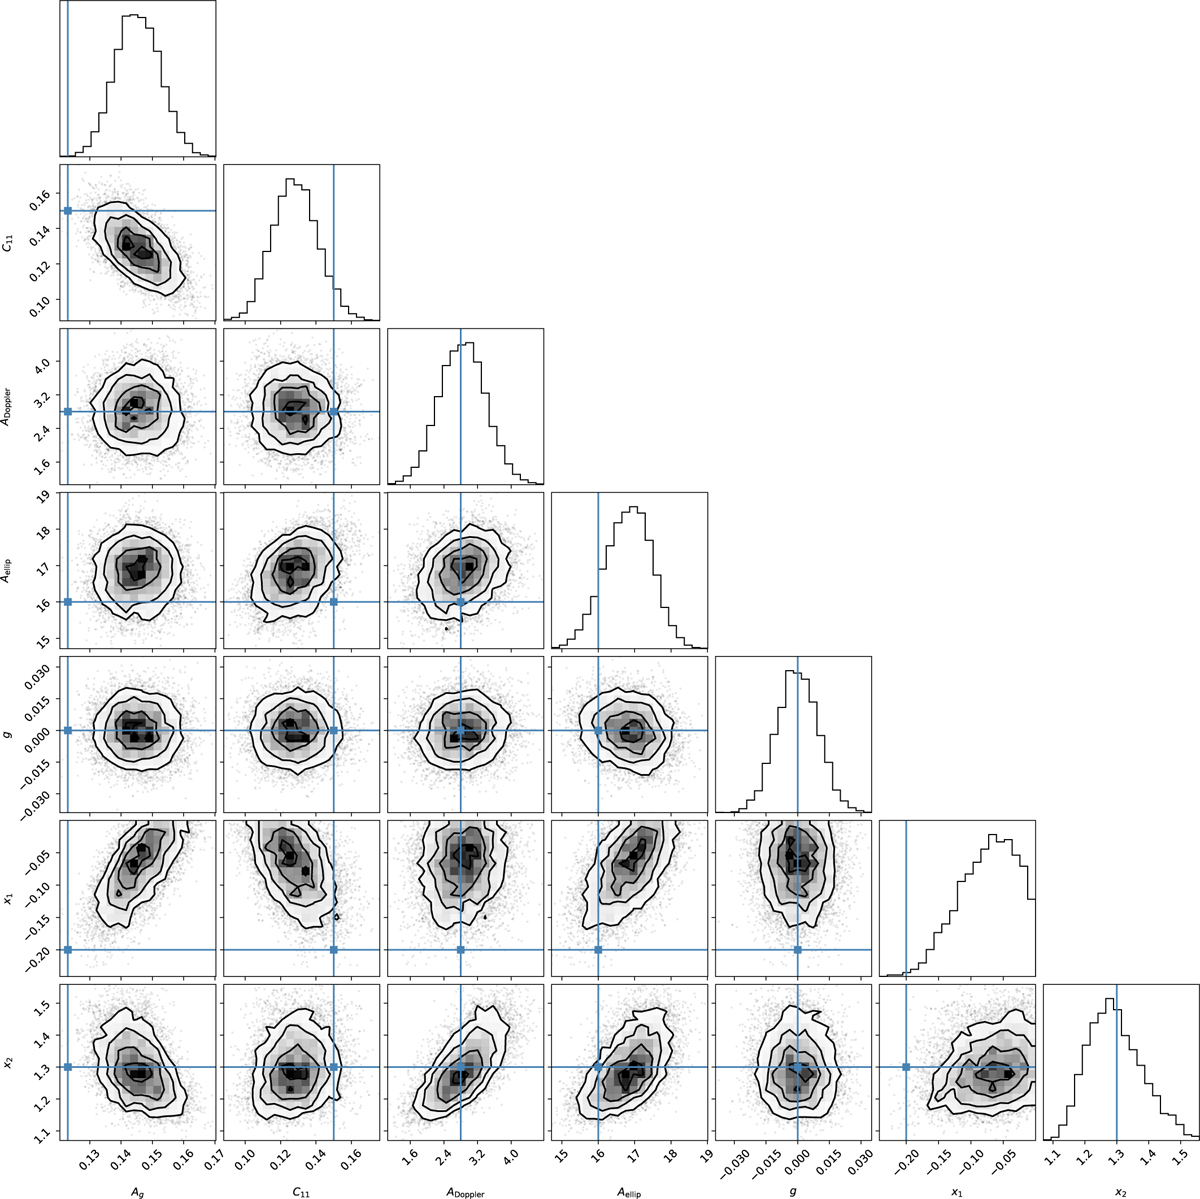
Posterior correlation plot demonstrating an injection-recovery exercise with a synthetic inhomogeneous phase curve signal injected into the real Kepler light curve of KIC 8424992. The blue lines indicate the values chosen for each of the injected phase curve parameters. The most challenging inference in this analysis is determining which fraction of the phase curve signal comes from reflection or thermal emission, since higher geometric albedos and hotter daysides both increase the planetary flux. This produces the anti-correlation between C11 and Ag, since a cooler dayside can produce a similar phase curve to a more reflective atmosphere. The model produces accurate inferences despite this degeneracy by fitting for complementary parameters that define the shape of the phase curve at all phases, such as x1, x2, and g.
Current usage metrics show cumulative count of Article Views (full-text article views including HTML views, PDF and ePub downloads, according to the available data) and Abstracts Views on Vision4Press platform.
Data correspond to usage on the plateform after 2015. The current usage metrics is available 48-96 hours after online publication and is updated daily on week days.
Initial download of the metrics may take a while.