Fig. 12
Download original image
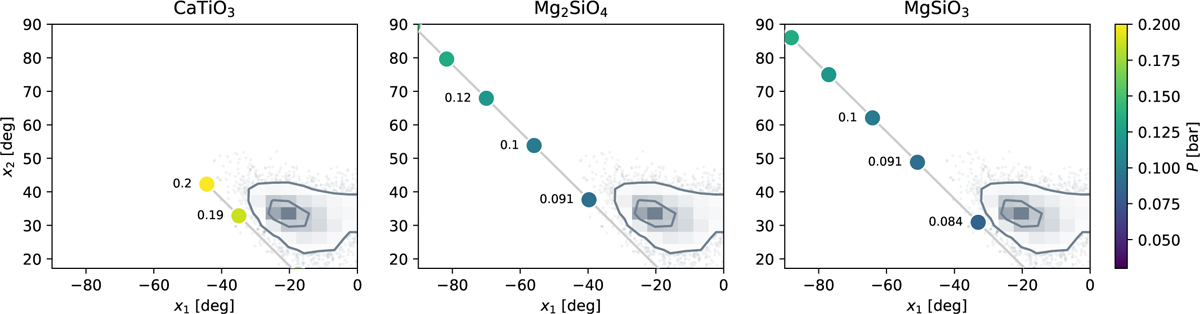
Joint posterior distributions for the planetary longitudes bounding the less reflective region (xı, x2) for Kepler-41 b in grayscale, in comparison with the theoretical predictions for several refractory species in each subplot, in color. The gray curves indicate the 1 and 2σ contours for (x1, x2). Each species’ condensation temperature is converted to a coordinate in (xı, x2), which varies as a function of the cloud pressure, producing the track of colored points which are labeled with the corresponding cloud pressure in units of bar. For example, the observed longitudes spanning the less reflective region of Kepler-41 b are 2σ consistent with CaTiO3 clouds located near 0.19 bar. Plausible cloud pressures for all species range from 0.08 to 0.2 bar.
Current usage metrics show cumulative count of Article Views (full-text article views including HTML views, PDF and ePub downloads, according to the available data) and Abstracts Views on Vision4Press platform.
Data correspond to usage on the plateform after 2015. The current usage metrics is available 48-96 hours after online publication and is updated daily on week days.
Initial download of the metrics may take a while.