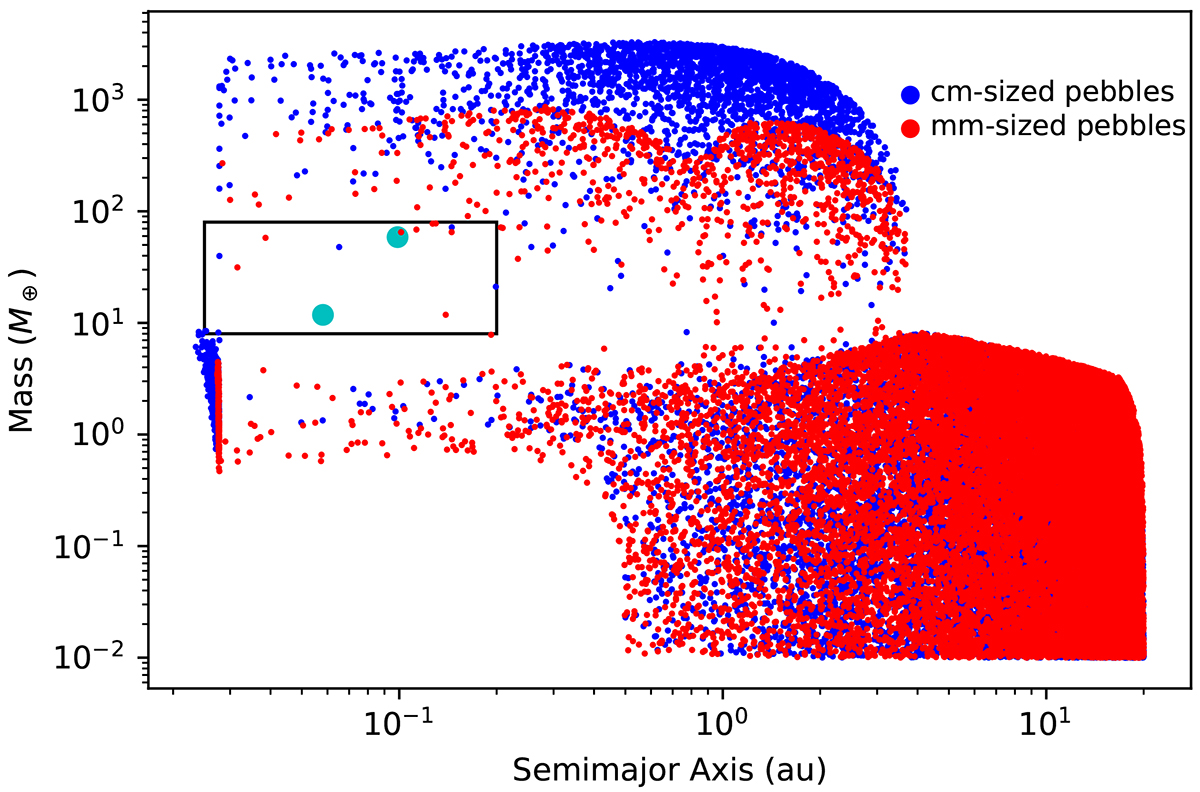
Fig. C.1.
Download original image
Synthetic populations of planets resulting from the two Monte Carlo runs of 20000 extractions each with GroMiT. The plot shows the final masses and orbital positions of the simulated growth tracks (see Fig. 4 for illustrative examples of the growth tracks). The red symbols are associated with planets formed in discs dominated by mm-sized pebbles, and the blue symbols with planets formed in discs dominated by cm-sized pebbles. TOI-5398 b and c are represented by the two larger cyan-filled circles. The black box highlights the region of the parameter space populated by the successful solutions (see main text for details).
Current usage metrics show cumulative count of Article Views (full-text article views including HTML views, PDF and ePub downloads, according to the available data) and Abstracts Views on Vision4Press platform.
Data correspond to usage on the plateform after 2015. The current usage metrics is available 48-96 hours after online publication and is updated daily on week days.
Initial download of the metrics may take a while.