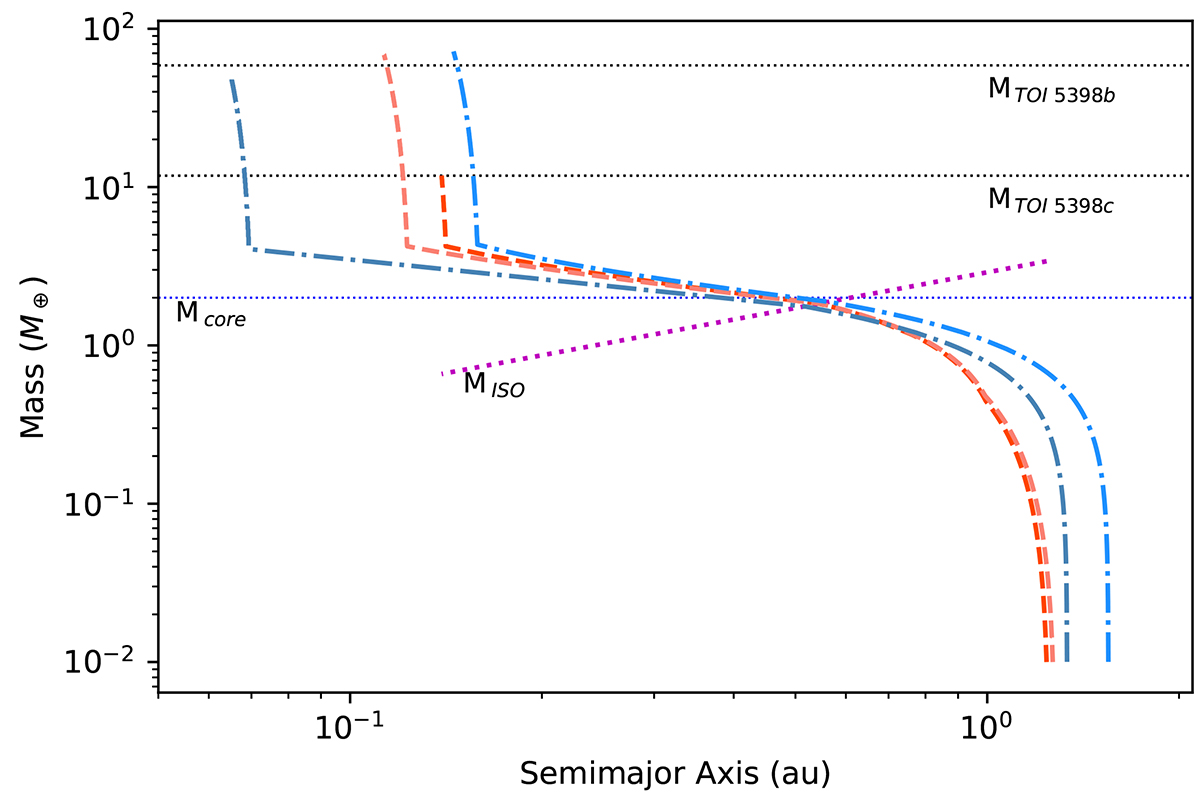
Fig. 4.
Download original image
Illustrative example of planetary growth tracks satisfying the selection conditions associated with the black box in Fig. C.1 (see main text for details). The growth tracks are projected in the semimajor axis–planetary mass space. The red curves are for planets formed in discs dominated by millimetre-sized pebbles, while the blue curves are for planets formed in discs dominated by centimetre-sized pebbles. All successful tracks are associated with formation regions comprised between 1 and 2 AU and have planetary cores of about 2 M⊕. The core mass is identified by the mass value where the growth tracks intercept the pebble isolation mass curve (purple dotted line).
Current usage metrics show cumulative count of Article Views (full-text article views including HTML views, PDF and ePub downloads, according to the available data) and Abstracts Views on Vision4Press platform.
Data correspond to usage on the plateform after 2015. The current usage metrics is available 48-96 hours after online publication and is updated daily on week days.
Initial download of the metrics may take a while.