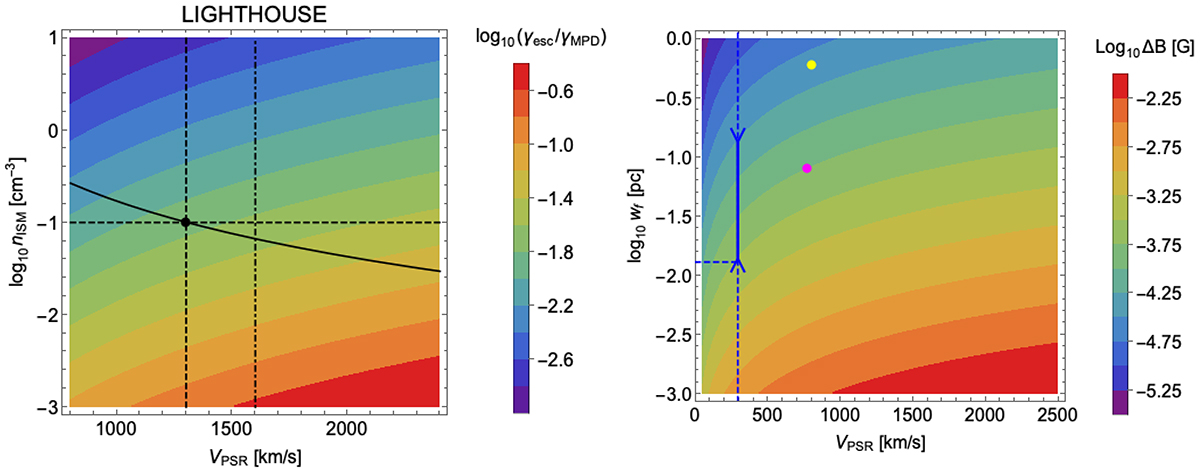
Fig. 2.
Download original image
Left panel: Color map of the ratio γesc/γMPD (base-10 logarithm) for the Lighthouse Nebula, as a function of the pulsar velocity, Vpsr, and ambient number density, nISM. The solid black curve shows the relation we used to estimate nISM (pressure equilibrium at the bow shock standoff distance, d0). The black point indicates the position of the system based on the best estimate (Pavan et al. 2014) of nISM: nISM = 0.1 cm−3, Vpsr = 1300 km s−1. The vertical lines mark the maximum value of Vpsr that makes our model viable for nISM = 0.1 cm−3 (Vpsr, max = 1300 km s−1, dashed line) and nISM determined from Vpsr and d0 (Vpsr, max = 1600 km s−1, dash-dotted line). Right panel: Color map of ΔB as a function of Vpsr and wf (uncertainties on the source distance reflect on both quantities). The best values for the Guitar and the Lighthouse Nebula are represented as magenta and yellow circles, respectively. The upper and lower limits obtained for J2030+4415 are shown as blue downward and upward arrows, respectively. The horizontal blue line shows the current filament thickness.
Current usage metrics show cumulative count of Article Views (full-text article views including HTML views, PDF and ePub downloads, according to the available data) and Abstracts Views on Vision4Press platform.
Data correspond to usage on the plateform after 2015. The current usage metrics is available 48-96 hours after online publication and is updated daily on week days.
Initial download of the metrics may take a while.