Fig. 1.
Download original image
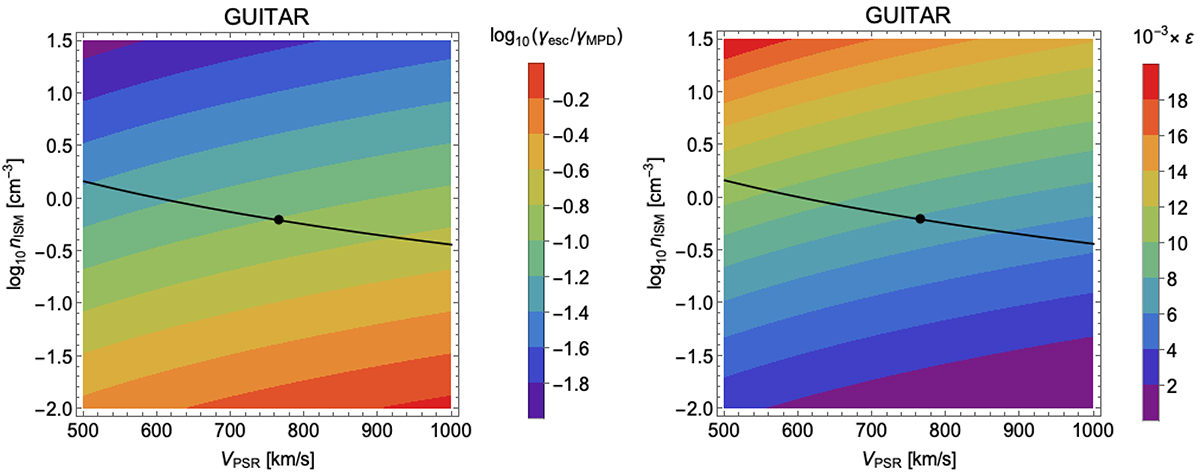
Guitar Nebula: Color map of the ratio, γesc/γMPD (base-10 logarithm, left panel), and the efficiency, ϵ (right panel), as a function of the pulsar velocity, Vpsr (within the estimated uncertainty; de Vries et al. 2022), and the ambient number density, nISM. The black curve shows the relation we used to estimate nISM (pressure equilibrium at the bow shock standoff distance, d0). The black points indicate the position of the system for the best estimate of Vpsr (and nISM).
Current usage metrics show cumulative count of Article Views (full-text article views including HTML views, PDF and ePub downloads, according to the available data) and Abstracts Views on Vision4Press platform.
Data correspond to usage on the plateform after 2015. The current usage metrics is available 48-96 hours after online publication and is updated daily on week days.
Initial download of the metrics may take a while.