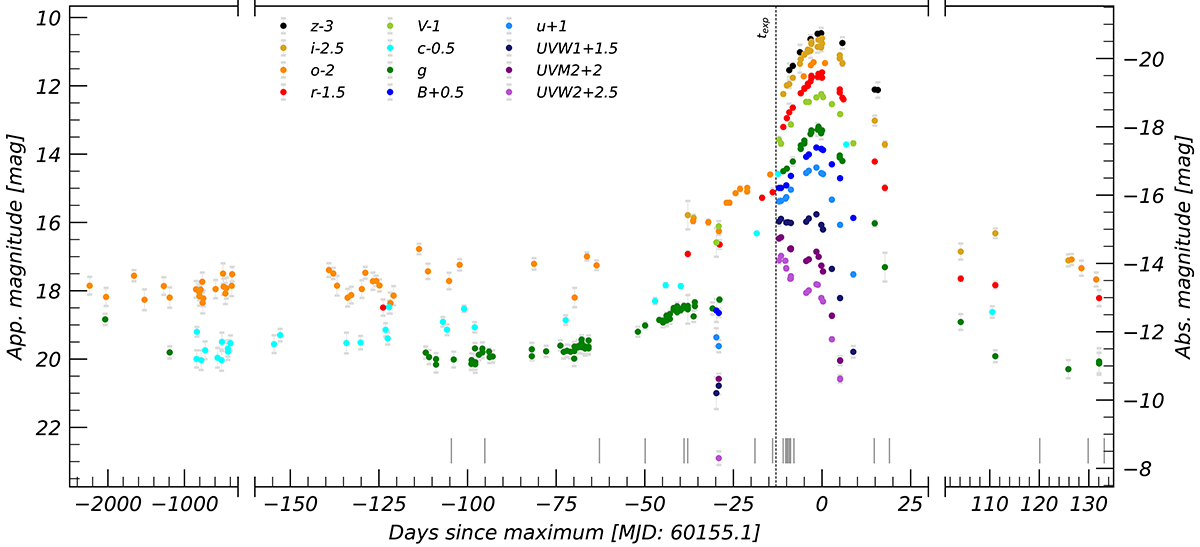
Fig. 3.
Download original image
Multi-band light curve of SN 2023fyq, with each band offset for clarity. Vertical grey bars denote epochs of spectral observations. Absolute magnitudes, based on a distance of 17.2 Mpc, are shown on the right Y-axis, uncorrected for MW or host extinction. Note the broken X-axis, which highlights the long-lived progenitor activity.
Current usage metrics show cumulative count of Article Views (full-text article views including HTML views, PDF and ePub downloads, according to the available data) and Abstracts Views on Vision4Press platform.
Data correspond to usage on the plateform after 2015. The current usage metrics is available 48-96 hours after online publication and is updated daily on week days.
Initial download of the metrics may take a while.