Fig. 3.
Download original image
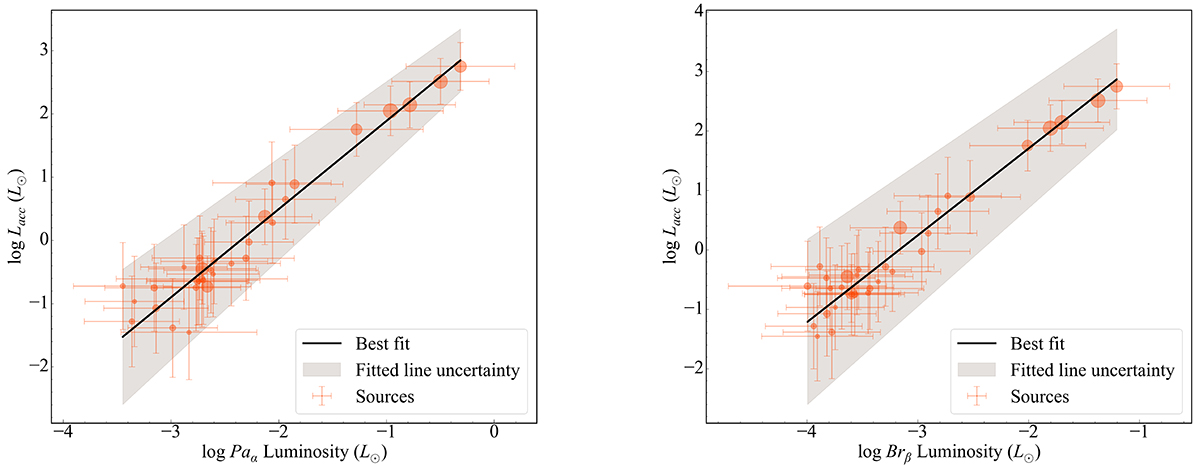
Relationship between Lacc with Paα and Brβ. The size of the circle scales with the mass of the source. The black line is the line of best fit, determined via ODR. The grey shaded band is the uncertainty of the best fit line. Panel a: The scatter between data and the line of best fit is σ = 0.27. Panel b: The scatter between data and the line of best fit is σ = 0.27.
Current usage metrics show cumulative count of Article Views (full-text article views including HTML views, PDF and ePub downloads, according to the available data) and Abstracts Views on Vision4Press platform.
Data correspond to usage on the plateform after 2015. The current usage metrics is available 48-96 hours after online publication and is updated daily on week days.
Initial download of the metrics may take a while.