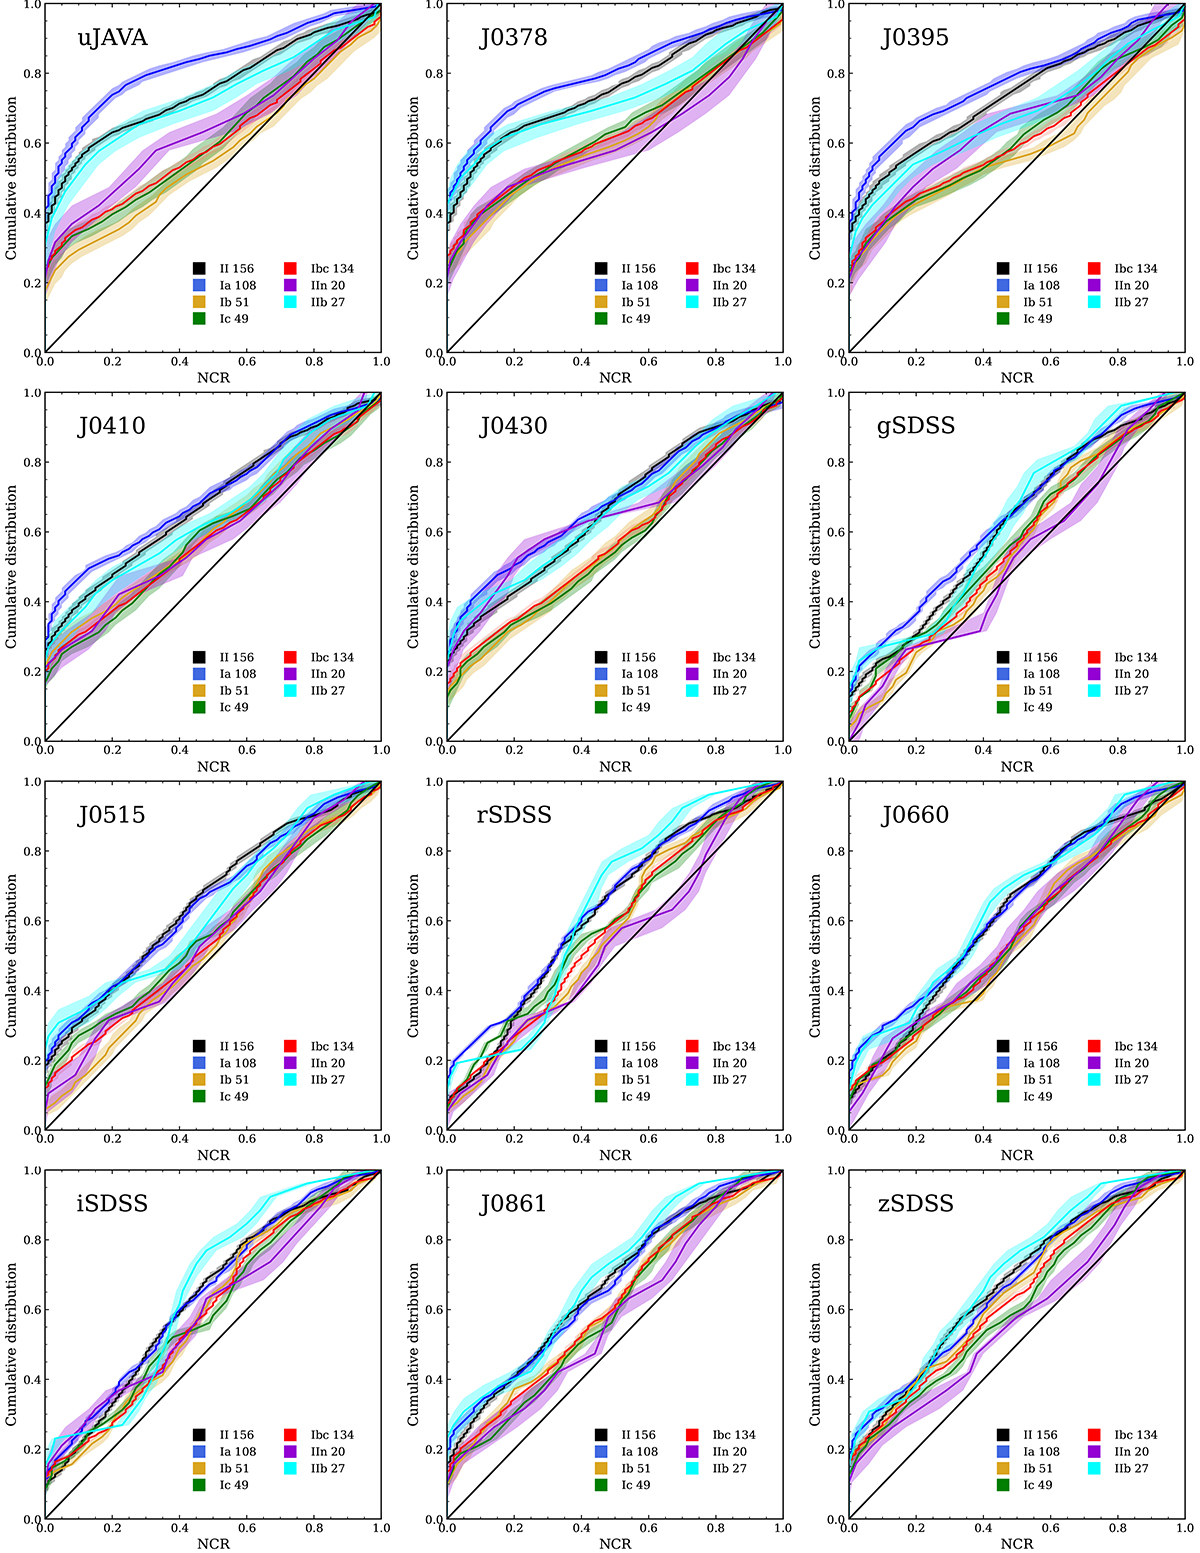
Fig. 6.

Download original image
Cumulative NCR distributions of 12 broad- and narrow-band filters. The straight black diagonal line represents a hypothetical distribution, infinite in size, which accurately traces the respective observed flux. Each SN distribution corresponds to the median and one sigma of the 30 000 NCR trial distributions as detailed in Sect. 5.1 of Lyman et al. (2021). It can be observed that as we move to redder filters (from gSDSS to zSDSS), the distributions for each type tend to become more similar along the diagonal. In contrast, there is a clearer distinction between them in the blue filters with more zero values.
Current usage metrics show cumulative count of Article Views (full-text article views including HTML views, PDF and ePub downloads, according to the available data) and Abstracts Views on Vision4Press platform.
Data correspond to usage on the plateform after 2015. The current usage metrics is available 48-96 hours after online publication and is updated daily on week days.
Initial download of the metrics may take a while.


