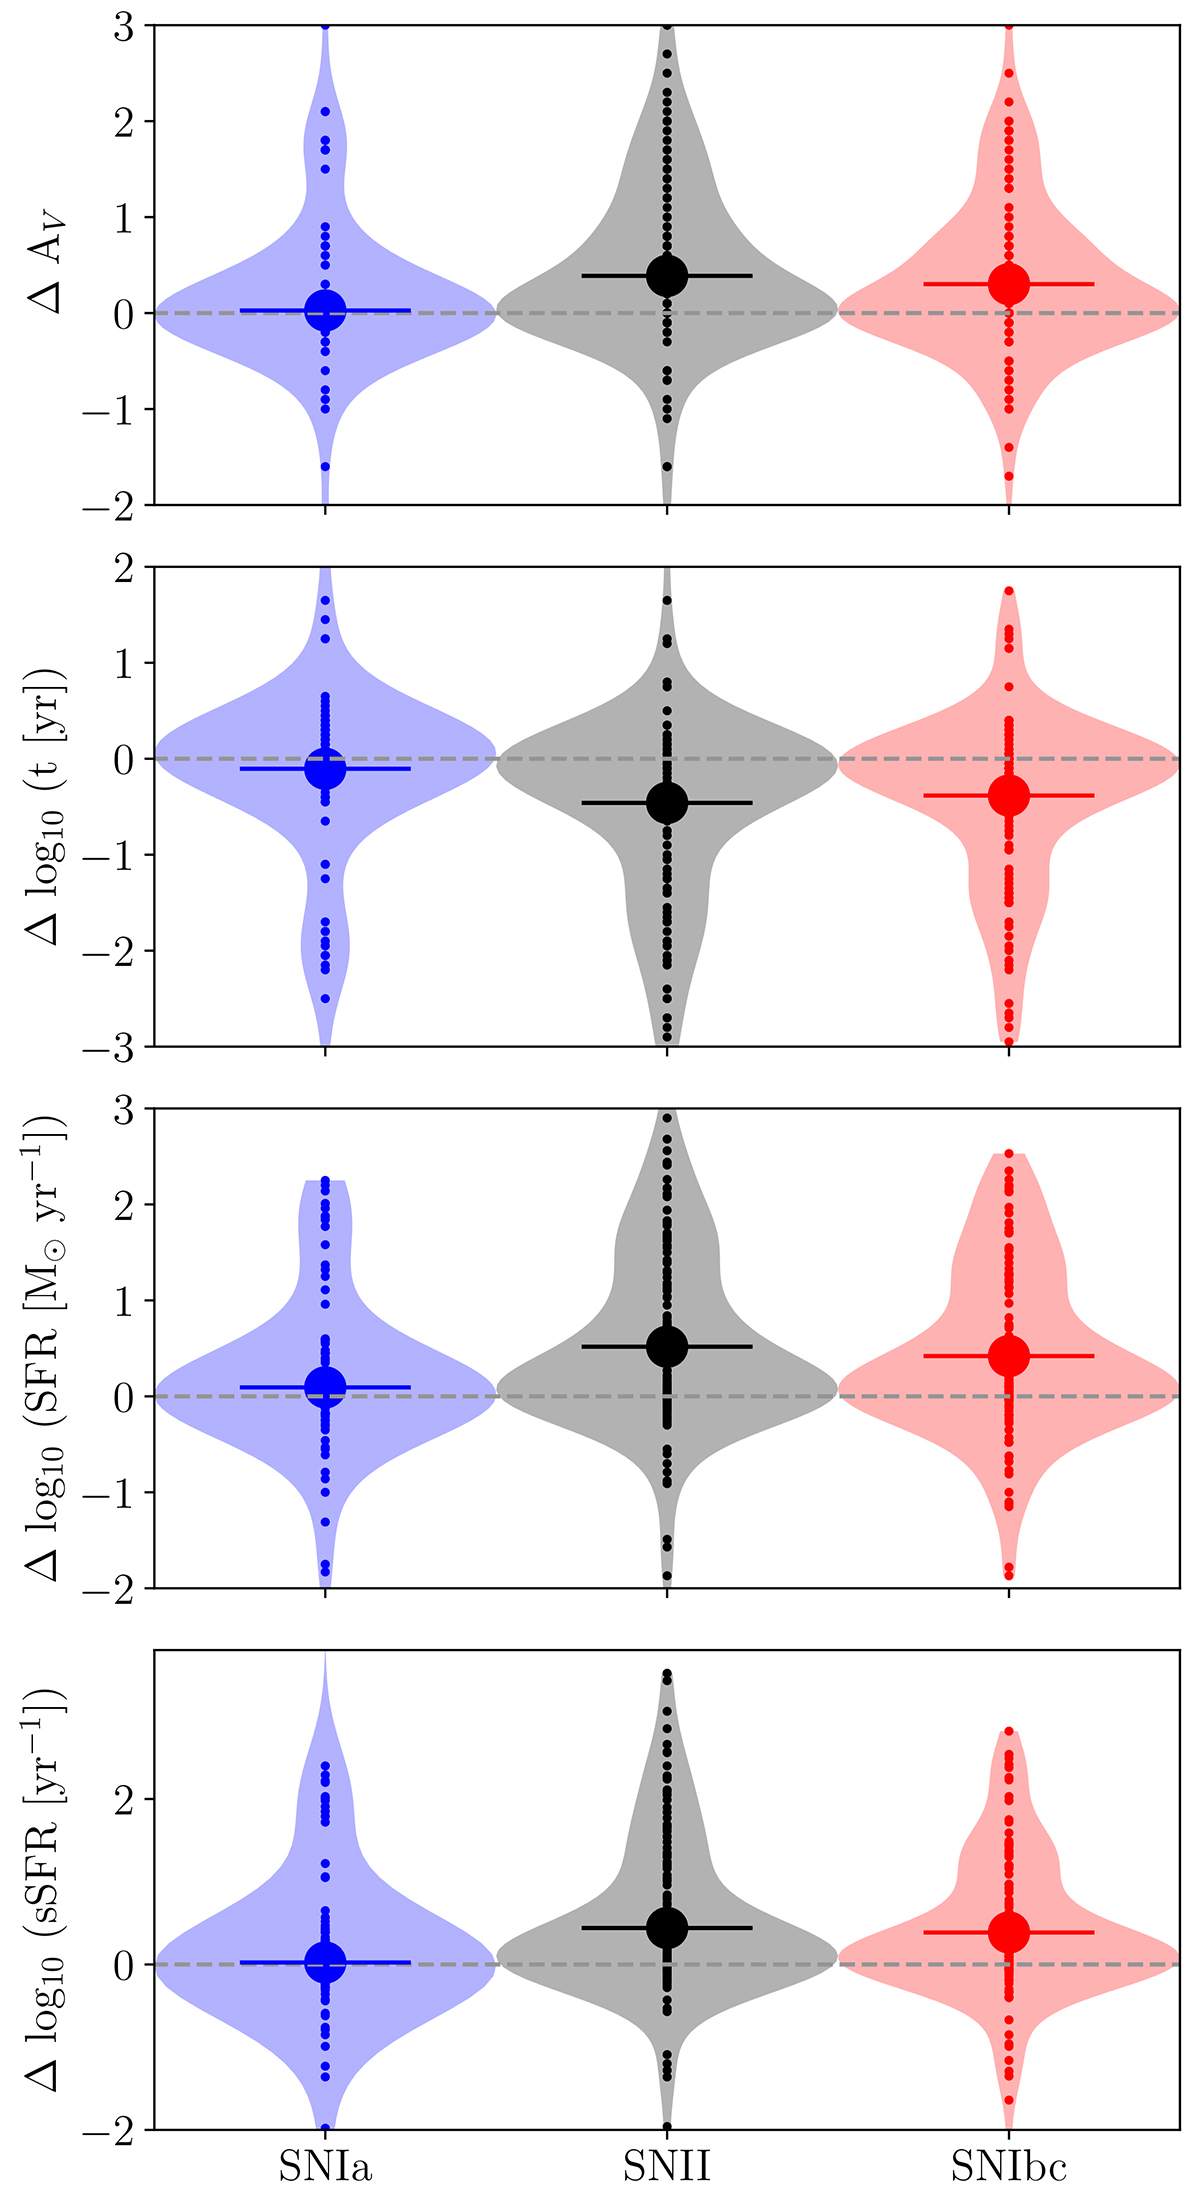
Fig. 12.

Download original image
Difference between FAST++ SED fits once all 12 J-PLUS filters are used and those only using the five broad-band SDSS filters, for the four main environmental parameters. Individual dots represent the difference of each parameter for each individual SN environment, while the big dot represents the average of all differences. Violin plots represent the shape of the distributions.
Current usage metrics show cumulative count of Article Views (full-text article views including HTML views, PDF and ePub downloads, according to the available data) and Abstracts Views on Vision4Press platform.
Data correspond to usage on the plateform after 2015. The current usage metrics is available 48-96 hours after online publication and is updated daily on week days.
Initial download of the metrics may take a while.


