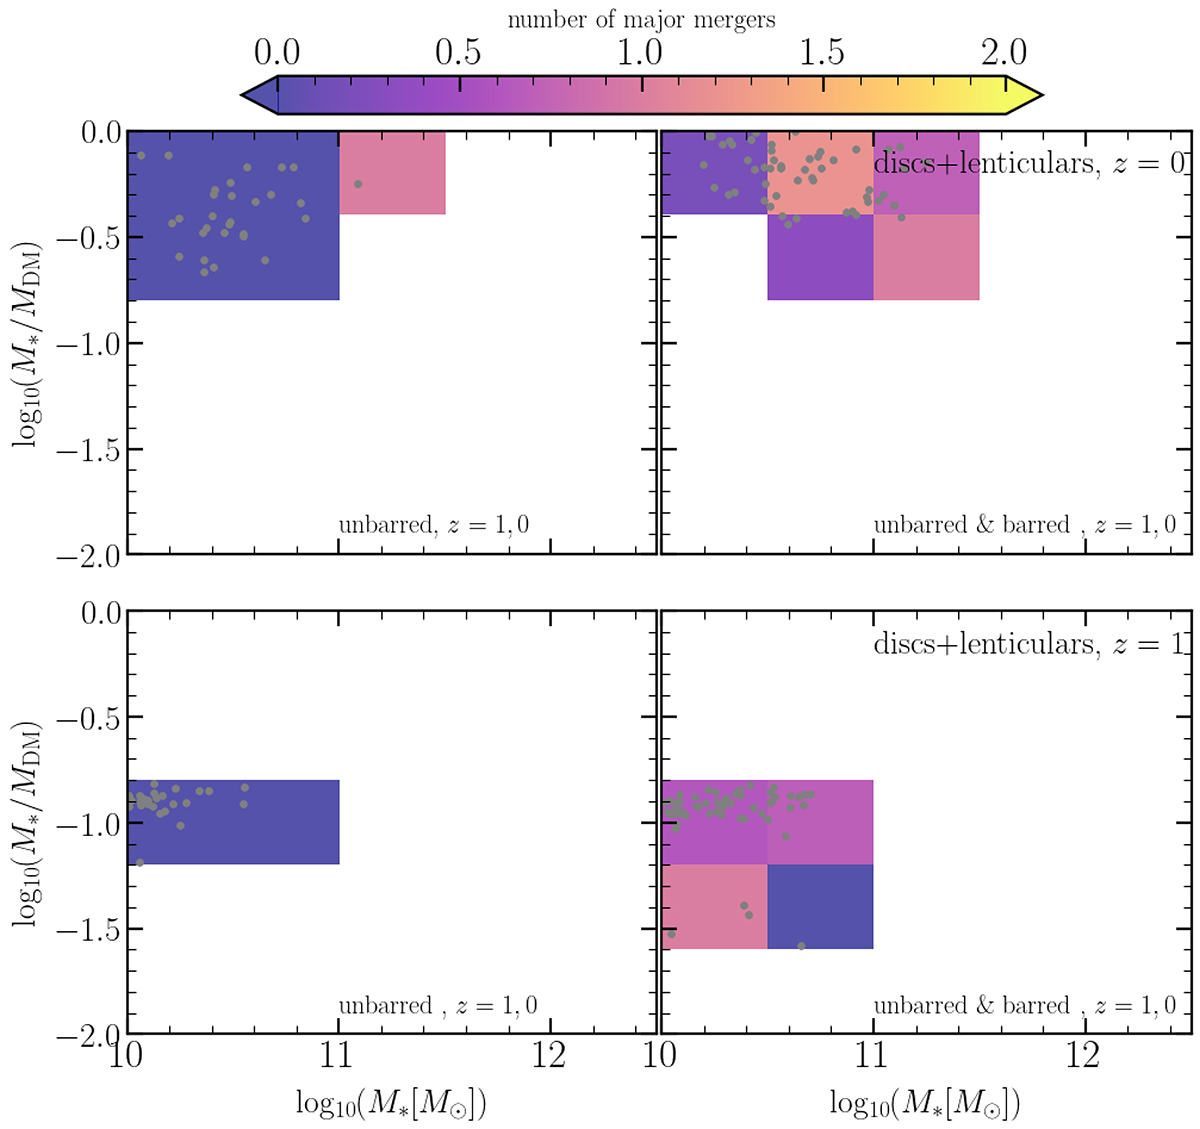
Fig. 17.
Download original image
M*/MDM as a function of stellar mass for central disc and lenticular galaxies at z = 1 and z = 0. The colour scheme corresponds to the mean number of major mergers for each bin since z = 2. The top left panel represents the disc descendants that do not develop a bar, whereas the top right panel represents those that develop a bar. The bottom row corresponds to those galaxies at redshift z = 1. Lenticular and disc galaxies that form a bar after z = 1 experience more mergers and have higher stellar-to-dark matter ratios than those galaxies that never form a bar for a given stellar mass.
Current usage metrics show cumulative count of Article Views (full-text article views including HTML views, PDF and ePub downloads, according to the available data) and Abstracts Views on Vision4Press platform.
Data correspond to usage on the plateform after 2015. The current usage metrics is available 48-96 hours after online publication and is updated daily on week days.
Initial download of the metrics may take a while.