Fig. 12.
Download original image
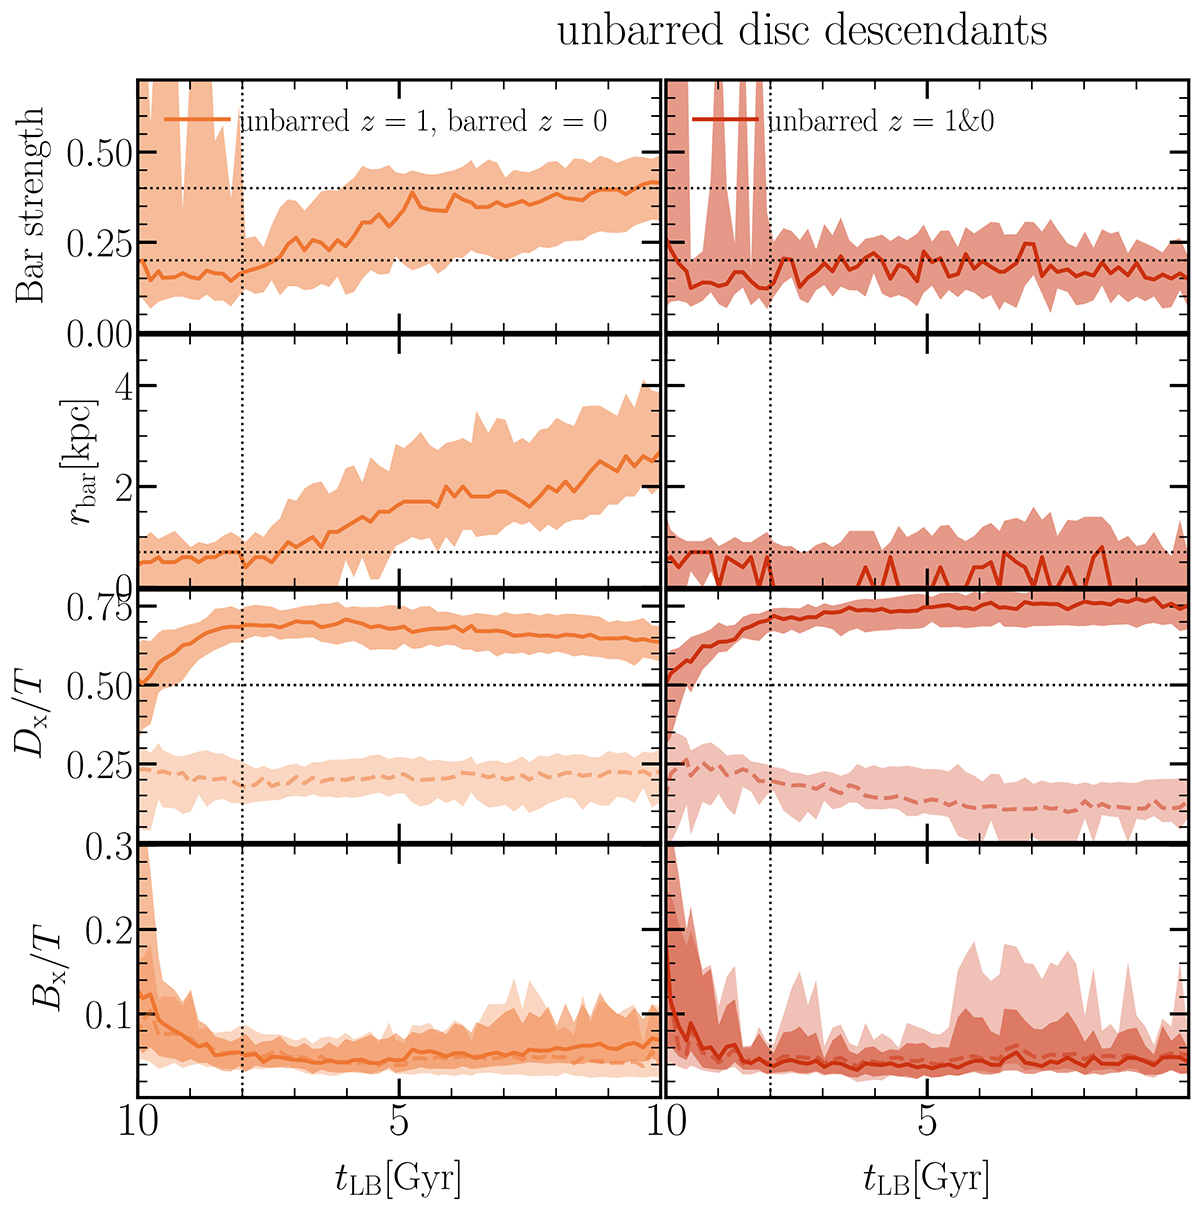
Evolution of unbarred disc galaxies divided into two subsamples: unbarred galaxies at z = 1 that become barred galaxies at z = 0 (left column), and those that were not able to develop a stable bar structure at any point up to z = 0 (right column). Solid lines represent the median values and the shaded area corresponds to the 20th and 80th percentiles of the distribution.
Current usage metrics show cumulative count of Article Views (full-text article views including HTML views, PDF and ePub downloads, according to the available data) and Abstracts Views on Vision4Press platform.
Data correspond to usage on the plateform after 2015. The current usage metrics is available 48-96 hours after online publication and is updated daily on week days.
Initial download of the metrics may take a while.