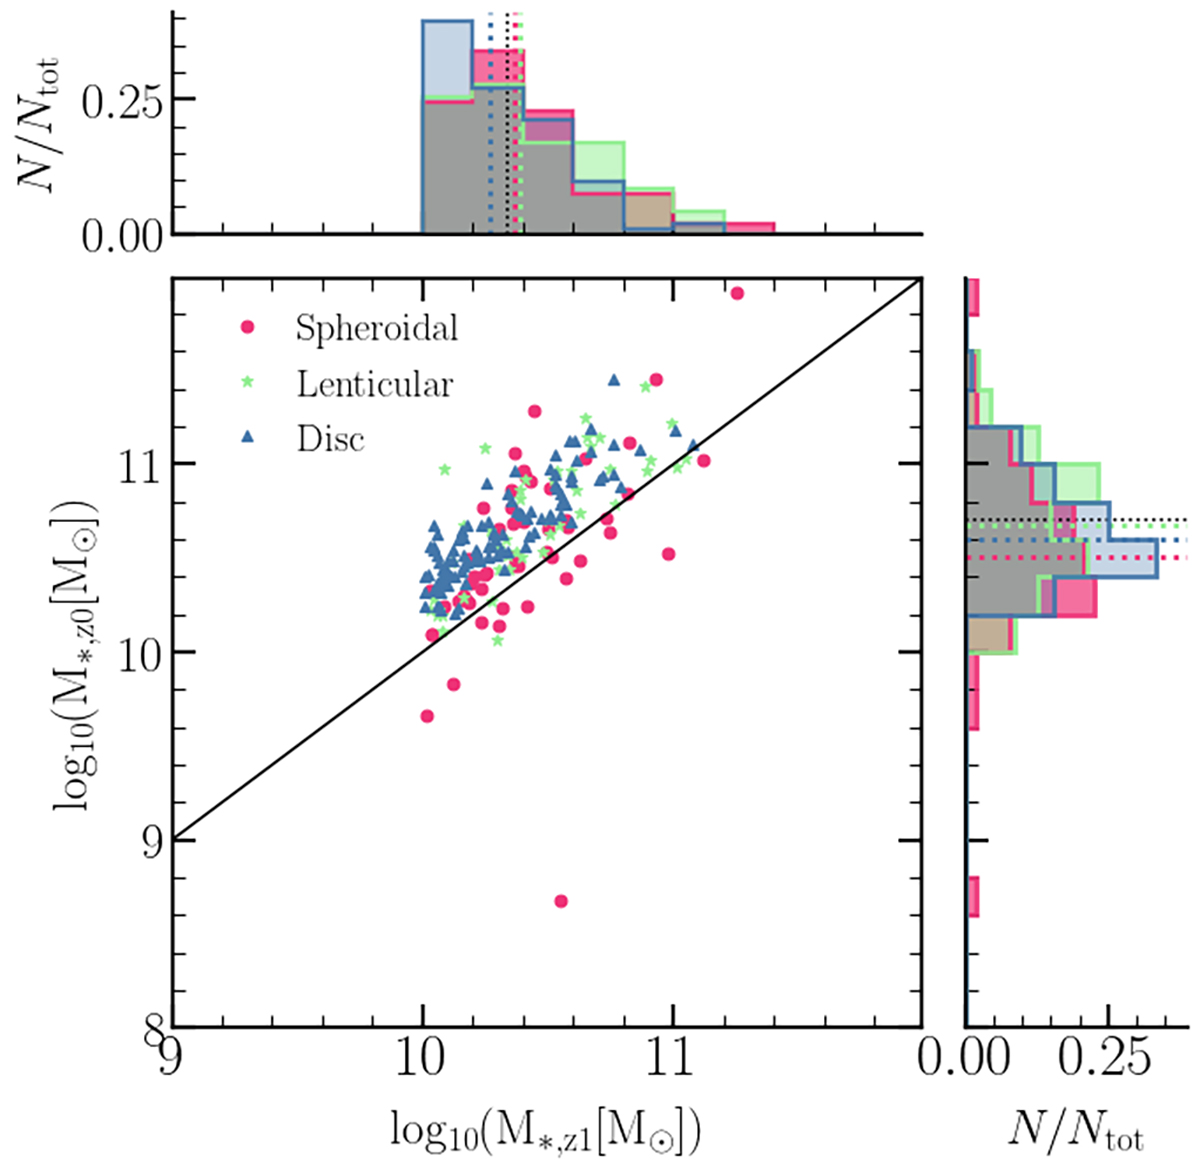
Fig. 1.
Download original image
Stellar mass of their descendants at z = 0 as a function of the stellar mass of disc galaxies at z = 1. Different markers and colours represent different morphologies of the descendant galaxies, as indicated in the legend. The black solid line represents a one-to-one relation. Panels along the margins show the distributions of stellar mass at z = 0 and z = 1. Dotted lines represent the median of each distribution and the black dotted line is the median stellar mass of the total sample. There is a mild evolution in stellar mass in the last 8 Gyr in the parent disc sample.
Current usage metrics show cumulative count of Article Views (full-text article views including HTML views, PDF and ePub downloads, according to the available data) and Abstracts Views on Vision4Press platform.
Data correspond to usage on the plateform after 2015. The current usage metrics is available 48-96 hours after online publication and is updated daily on week days.
Initial download of the metrics may take a while.