Open Access
Fig. 1.
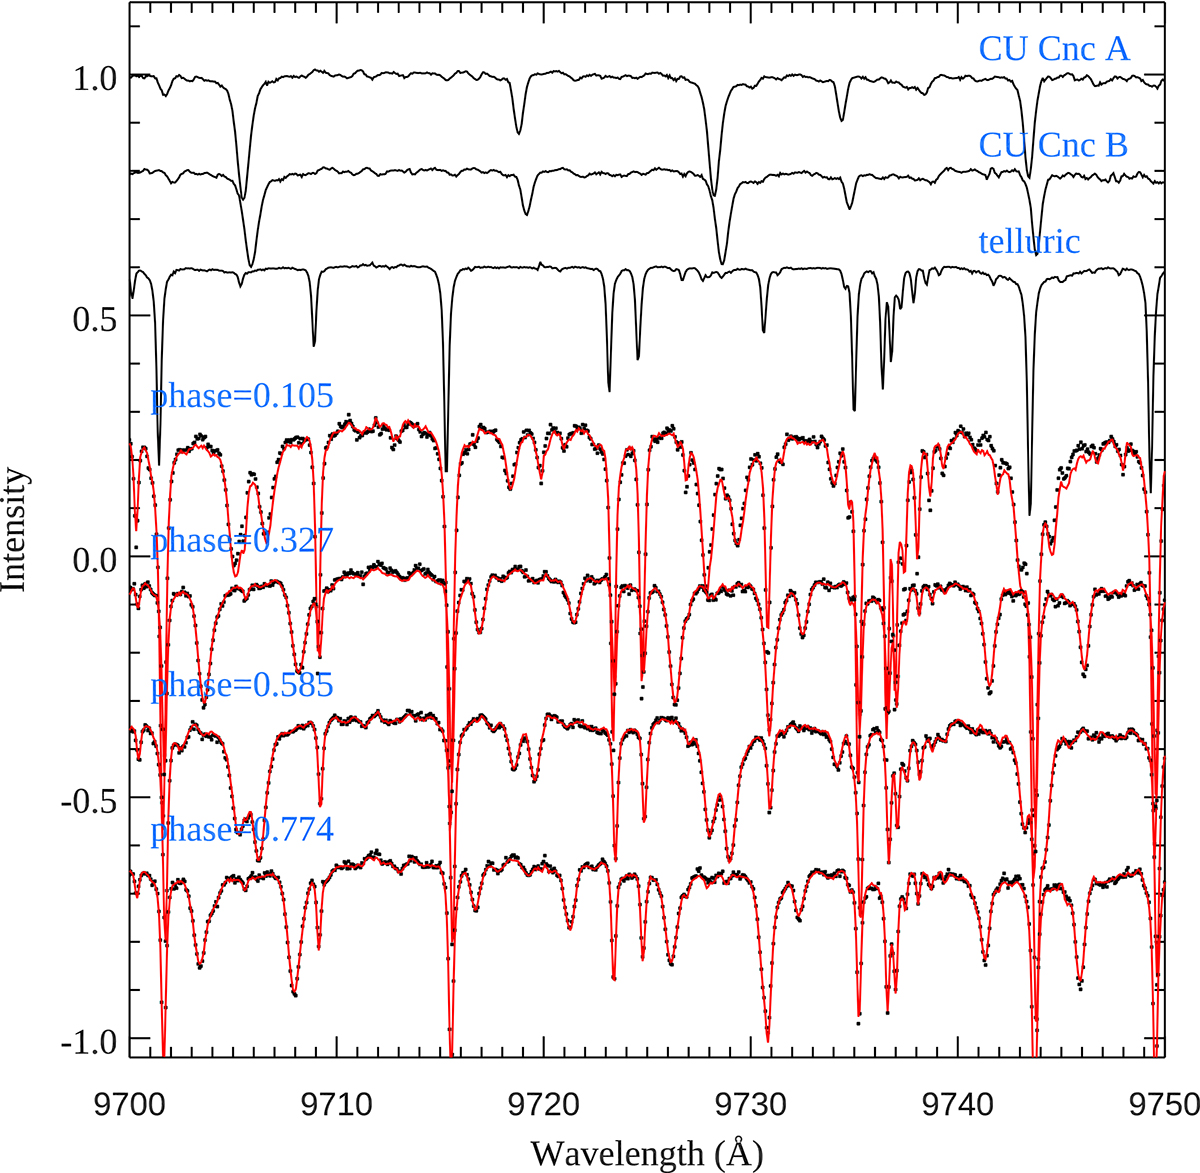
Download original image
Disentangled spectra of CU Cnc. The top three spectra show the time-averaged spectra of the A and B components as well as the telluric absorption. The bottom four compare the observed spectra (black dots) and the model fit with a combination of the three top spectra (red line).
Current usage metrics show cumulative count of Article Views (full-text article views including HTML views, PDF and ePub downloads, according to the available data) and Abstracts Views on Vision4Press platform.
Data correspond to usage on the plateform after 2015. The current usage metrics is available 48-96 hours after online publication and is updated daily on week days.
Initial download of the metrics may take a while.