Fig. 7
Download original image
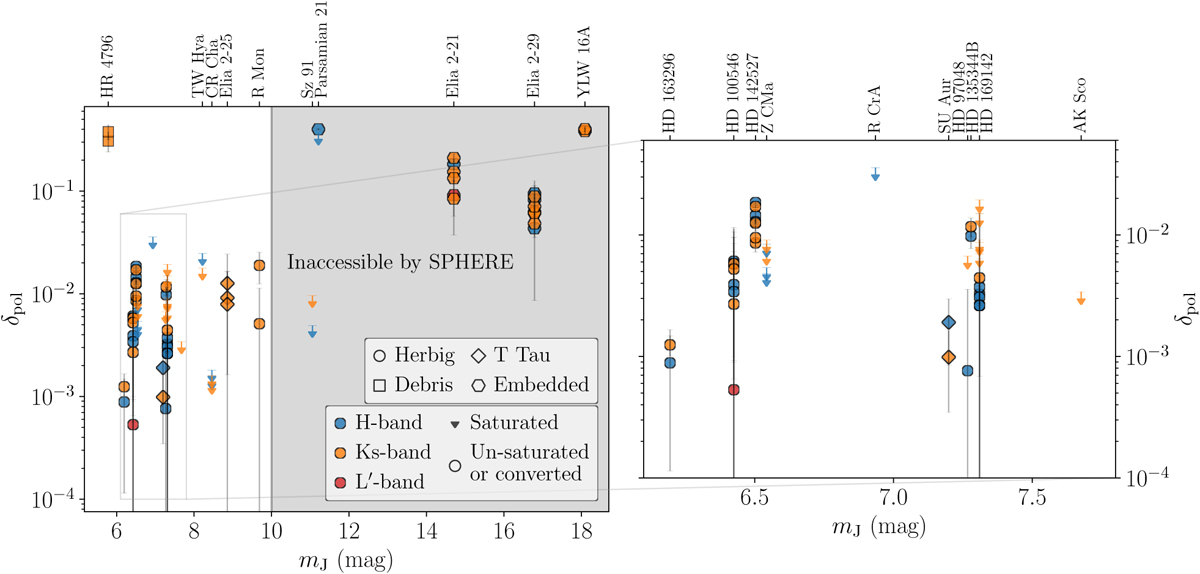
Polarised-to-stellar light contrast, δpol, plotted against the apparent J-band magnitude. The right panel shows a zoomed-in view of the bright m¡. The object names are listed along the top axes. The marker colours and symbols specify the observing filter and object type, respectively. Upper limits are shown when the stellar PSF was determined to be saturated. The error bars show the 3σ uncertainties. The grey shaded region shows the approximate magnitudes (mJ ≳ 10) inaccessible by the SPHERE AO system.
Current usage metrics show cumulative count of Article Views (full-text article views including HTML views, PDF and ePub downloads, according to the available data) and Abstracts Views on Vision4Press platform.
Data correspond to usage on the plateform after 2015. The current usage metrics is available 48-96 hours after online publication and is updated daily on week days.
Initial download of the metrics may take a while.