Fig. 6
Download original image
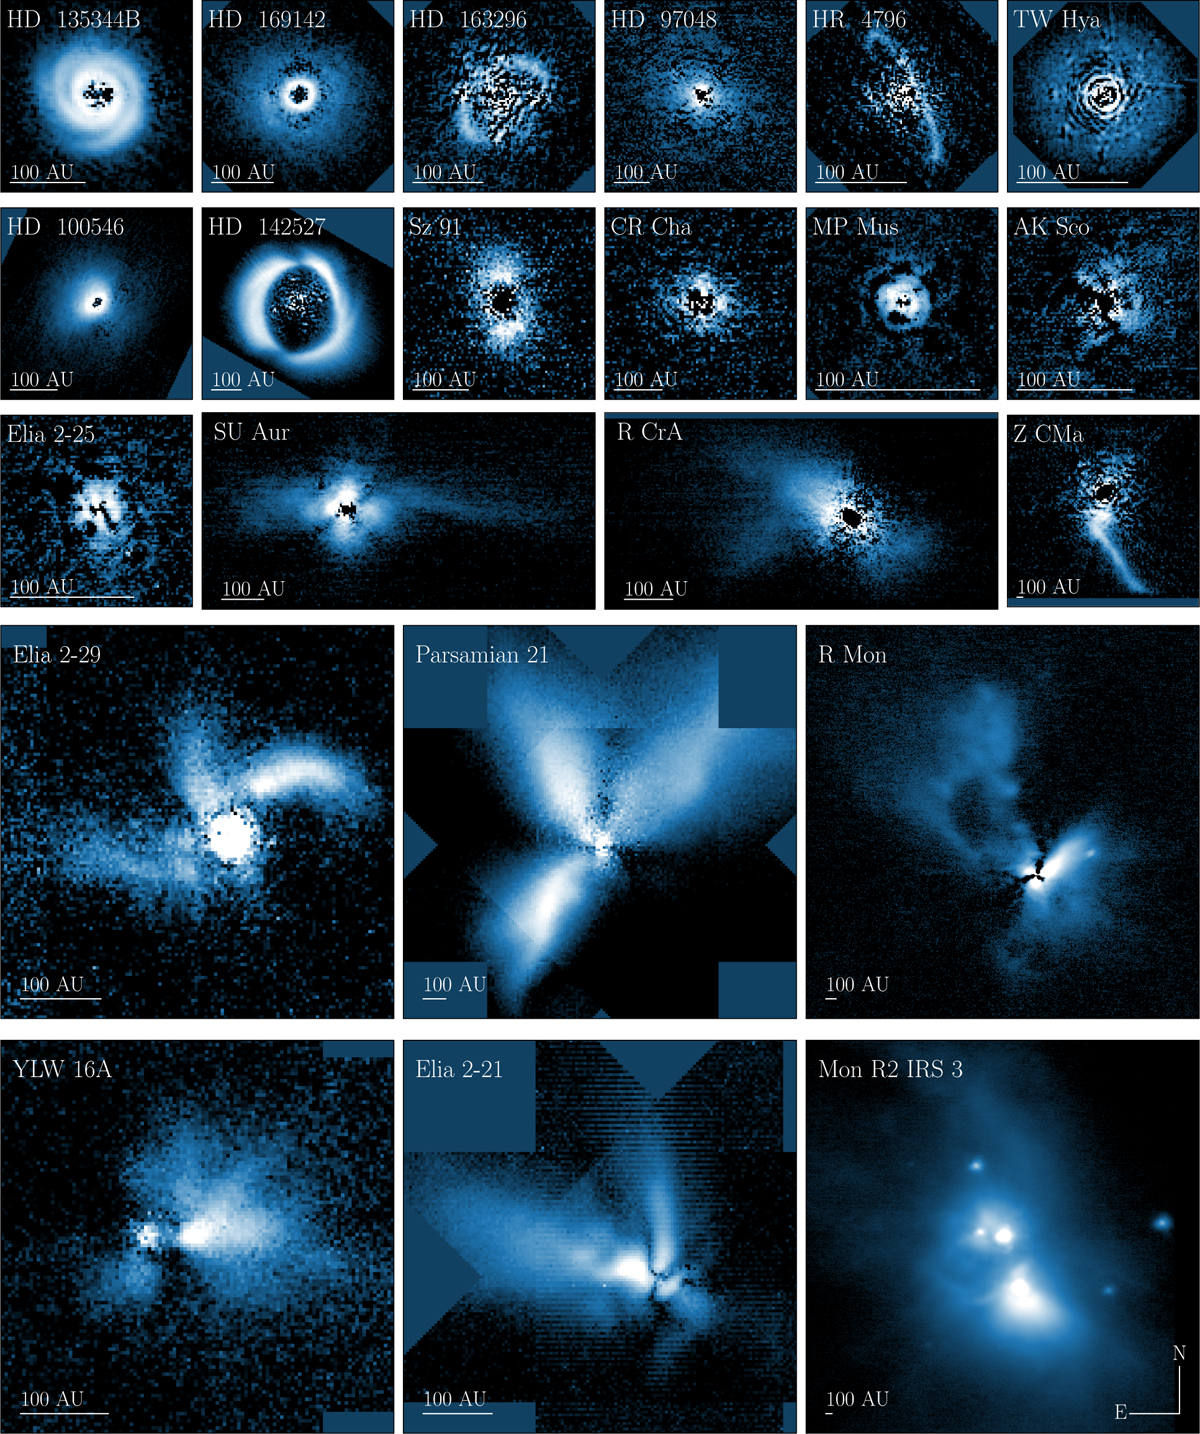
Gallery of young systems detected with NACO and reduced with PIPPIN. Each panel shows the polarised light on a logarithmic scale ranging between different values to highlight sub-structures. The highest degree of IP correction is used where possible. Scale bars in the lower-left corners of each panel indicate 100 AU at each object’s distance. HD 169142, R CrA, and Parsamian 21 are shown in the H band, MP Mus is shown in the IB_2.06 filter, and the other panels use Ks-band observations. Mon R2 IRS 3 shows the median Iq image because the Stokes U component was not observed. The images of YLW 16A and Elia 2-21 present the first polarised light detections in the NACO observations.
Current usage metrics show cumulative count of Article Views (full-text article views including HTML views, PDF and ePub downloads, according to the available data) and Abstracts Views on Vision4Press platform.
Data correspond to usage on the plateform after 2015. The current usage metrics is available 48-96 hours after online publication and is updated daily on week days.
Initial download of the metrics may take a while.