Fig. 5
Download original image
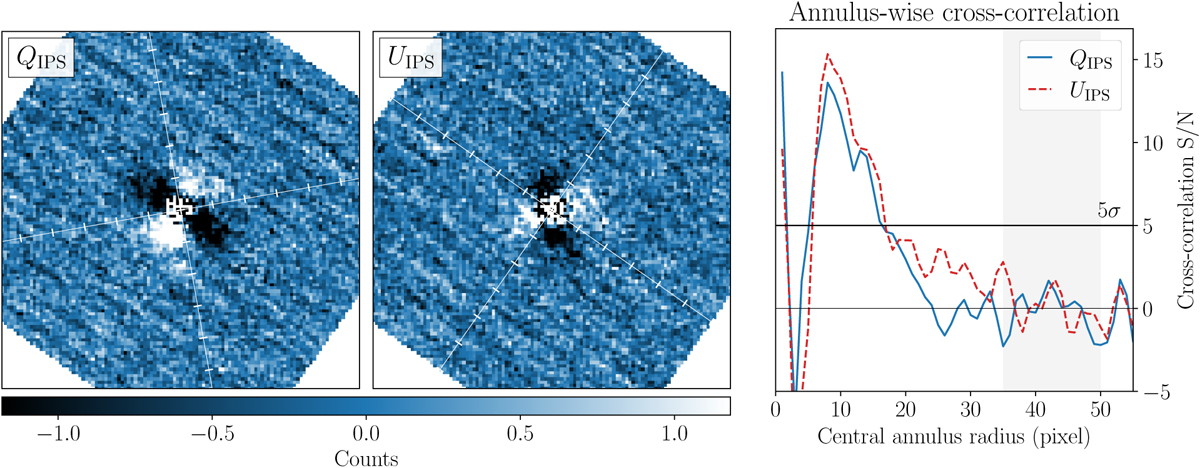
Detection analysis of HD 135344B observed in the narrowband NB_1.64. Left panels: QIPS and UIPS images divided by the white lines into the four quadrants of the expected butterfly pattern. Right panel: annulus-wise CCFs, with the S/N shown against the annulus radius in pixels. The results for the QIPS and UIPS images are plotted in blue and red, respectively. The shaded region specifies the coefficients used in normalising and converting the CCF into a S/N function. The 5σ detection limit is indicated with a horizontal line.
Current usage metrics show cumulative count of Article Views (full-text article views including HTML views, PDF and ePub downloads, according to the available data) and Abstracts Views on Vision4Press platform.
Data correspond to usage on the plateform after 2015. The current usage metrics is available 48-96 hours after online publication and is updated daily on week days.
Initial download of the metrics may take a while.