Fig. 3
Download original image
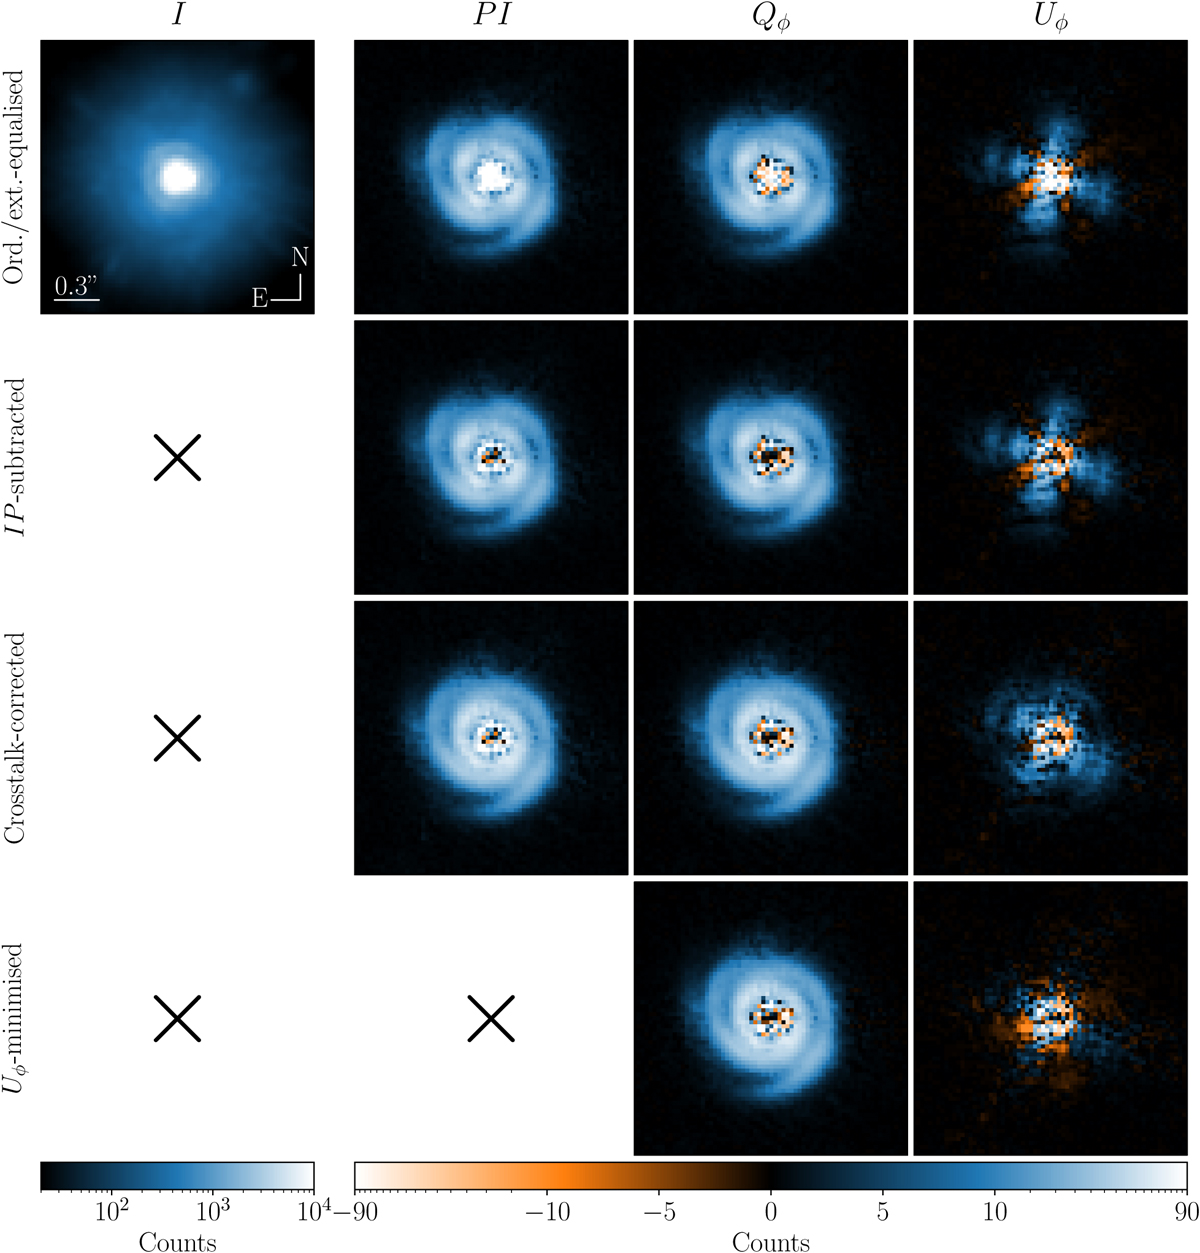
Final PIPPIN data products with different levels of IP correction. From left to right: median total intensity (I), polarised intensity (PI), and the azimuthal Stokes components Qϕ and Uϕ of HD 135344B observed in the Ks band. From top to bottom: equalised ordinary and extra-ordinary beams, IP-subtracted, crosstalk-corrected, and Uϕ-minimised results. The total intensity is shown with a logarithmic scale from 20 to 104 counts, whereas the other panels use a linear scale from −5 to +5 counts and a logarithmic scale up to ±90. The negative signal is depicted in orange, and in each image north points up and east to the left.
Current usage metrics show cumulative count of Article Views (full-text article views including HTML views, PDF and ePub downloads, according to the available data) and Abstracts Views on Vision4Press platform.
Data correspond to usage on the plateform after 2015. The current usage metrics is available 48-96 hours after online publication and is updated daily on week days.
Initial download of the metrics may take a while.