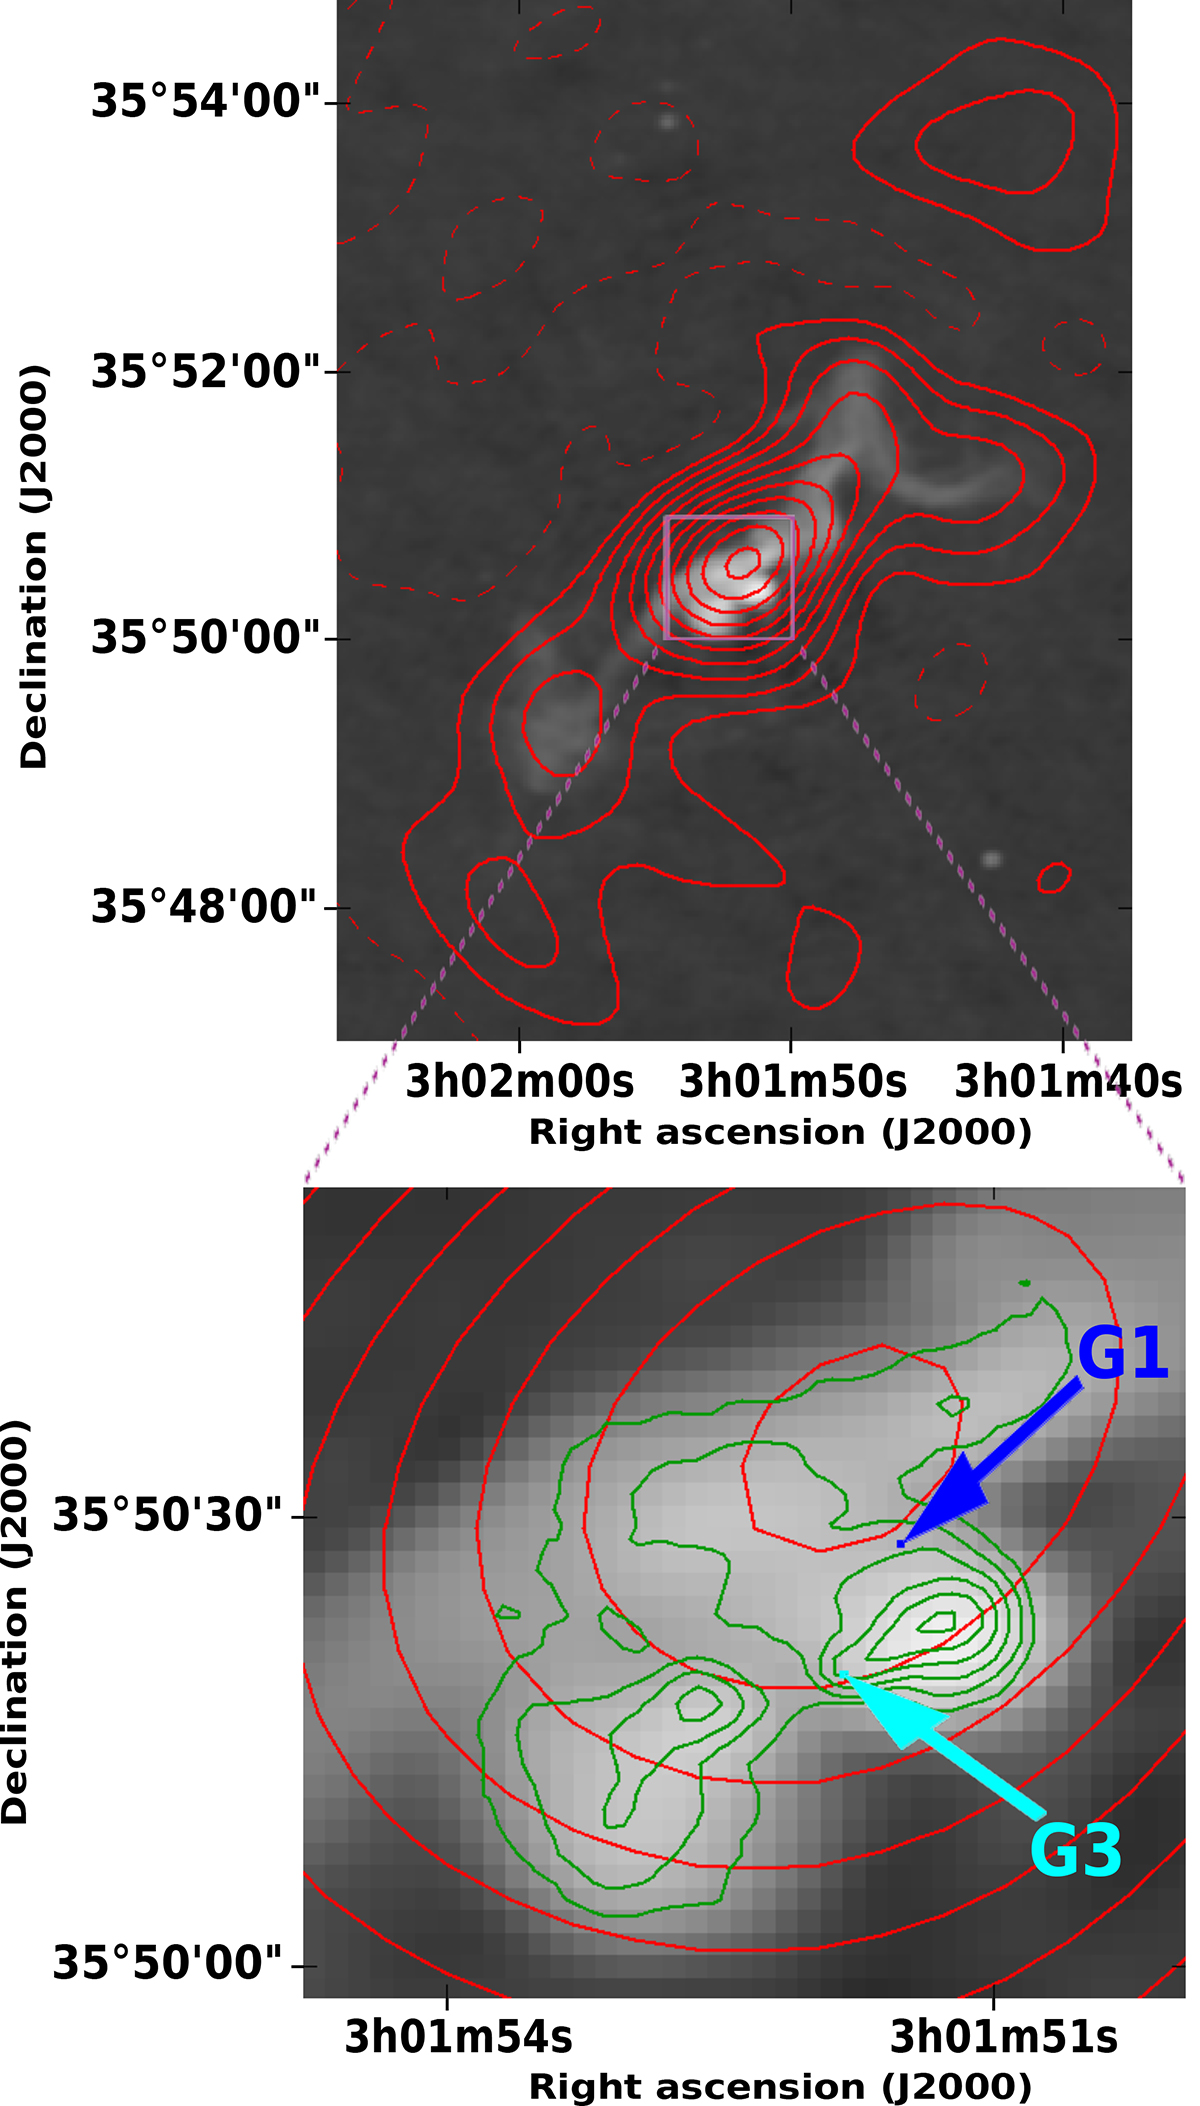
Fig. 4.
Download original image
Overlay maps of archival radio data of the radio source 4C 35.06, indicating the positions of the two radio AGNs detected with the EVN. Upper panel: 610 MHz GMRT observations published by Biju et al. (2017), shown with the grayscale map, and the 62 MHz observations published by Shulevski et al. (2015), shown with the red contours (ten levels spaced over a square root interval from −5σ to 183σ). Bottom panel: zoomed-in view of the central region of 4C 35.06. The green contours represent the most recent VLASS observations (VLASS2.2 observing campaign), confirming the presence of the inner lobes. The peak brightness of this map is 14.3 mJy beam−1, while the noise level is 0.14 mJy beam−1. The seven contour levels span the range −3σ to 100σ. The dark blue and light blue arrows indicate the EVN positions of galaxies G1 and G3, respectively.
Current usage metrics show cumulative count of Article Views (full-text article views including HTML views, PDF and ePub downloads, according to the available data) and Abstracts Views on Vision4Press platform.
Data correspond to usage on the plateform after 2015. The current usage metrics is available 48-96 hours after online publication and is updated daily on week days.
Initial download of the metrics may take a while.