Fig. 8
Download original image
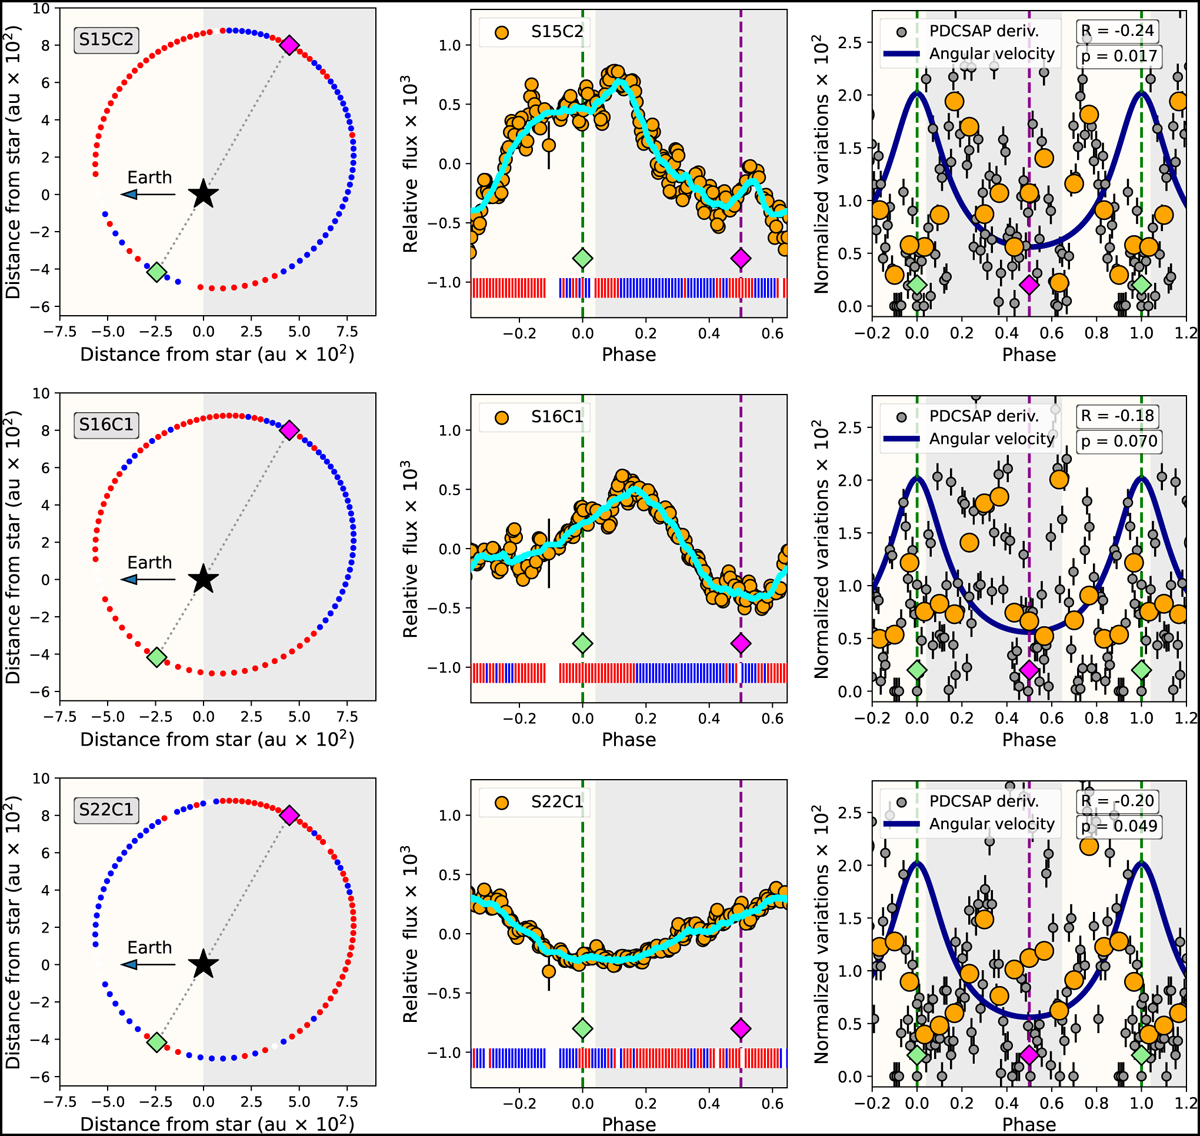
Links with the orbital motion of HD 118203 b. Left panels: orbital path of HD 118203 b, which follows the anticlockwise direction. The circles represent the location of HD 118203 b every ≃1.5 h and are coloured in red, blue, or white, depending on whether the photometric flux increases, decreases, or remains stable during that time lapse, respectively. Centre panels: TESS PDCSAP photometry of HD 118203 folded in phase with the orbital period of HD 118203 b and binned with ≃5% phase bins. The cyan line corresponds to the filtered photometry through a median filter with a kernel size of 701 cadences. The blue, red, and white vertical lines indicate whether the photometry increases, decreases, or remains stable in time lapses of ≃1.5 h. Right panels: comparison between the derivative of the phase-folded PDCSAP photometric variations of HD 118203 and the angular velocity of HD 118203 b. The orange circles correspond to binned data of 7% the orbital phase. In all panels: the green and magenta squares represent the periapsis and apoapsis of the orbit, respectively, and the white and grey backgrounds represent the orbital regions in which a hypothetical stellar co-rotating active region would be visible and not visible from Earth, respectively.
Current usage metrics show cumulative count of Article Views (full-text article views including HTML views, PDF and ePub downloads, according to the available data) and Abstracts Views on Vision4Press platform.
Data correspond to usage on the plateform after 2015. The current usage metrics is available 48-96 hours after online publication and is updated daily on week days.
Initial download of the metrics may take a while.