Fig. 6
Download original image
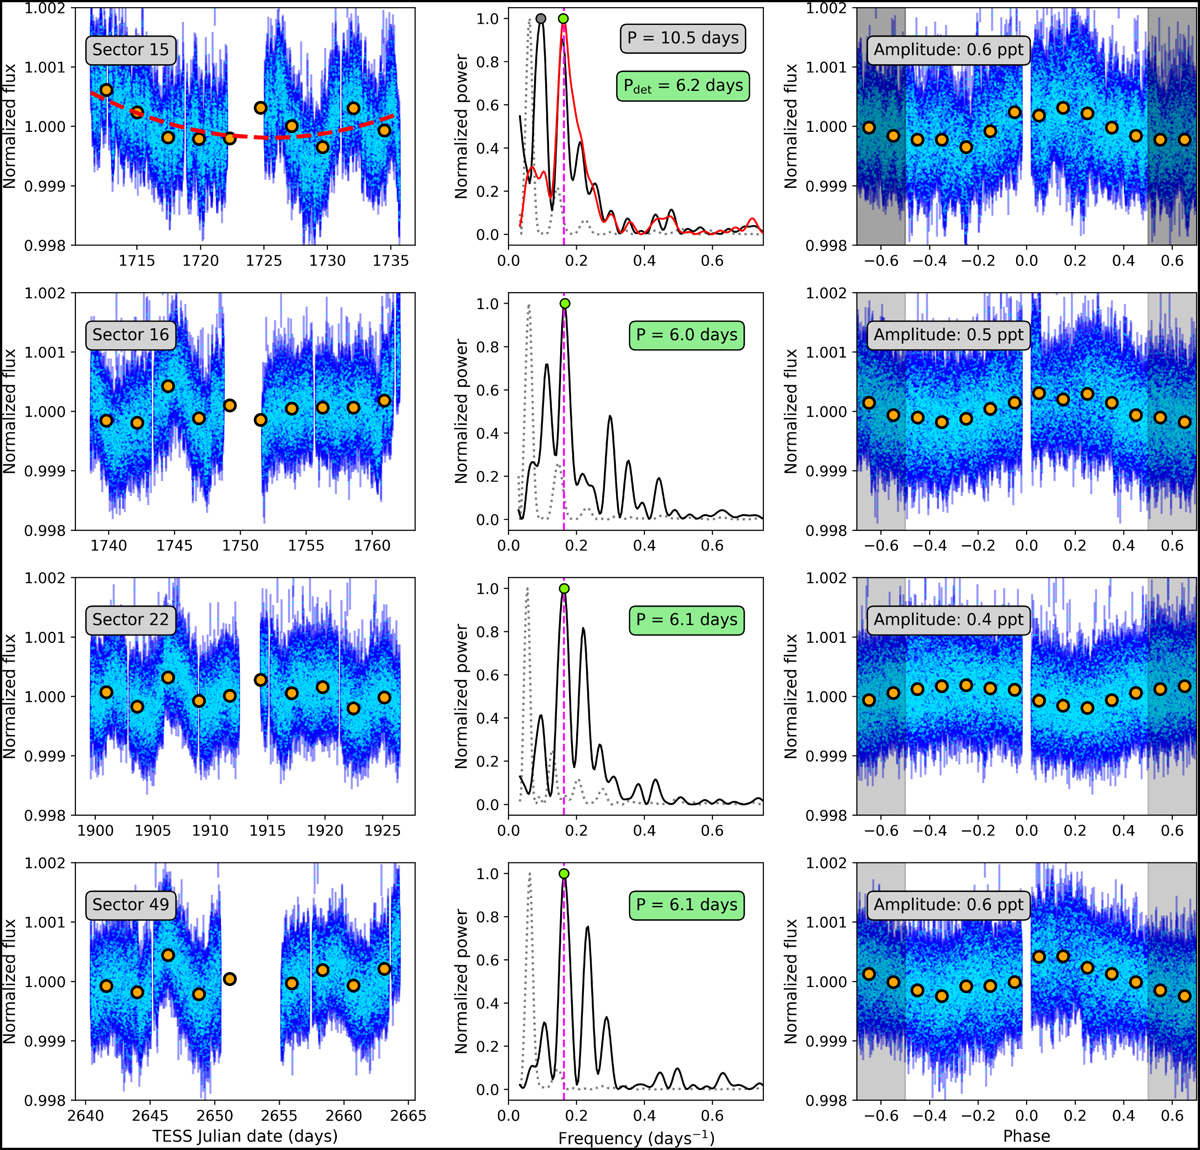
GLS periodograms of the TESS photometry time series and their window functions. Left panels: TESS photometry time series of HD 118203. The red dashed line within the S15 panel indicates the degree 2 polynomial fit used to de-trend the data. The orange circles correspond to 1.8-day binned data. Centre panels: GLS periodograms of the time series (solid black) and their window functions (dotted grey). In the S15 panel, the periodogram over the de-trended data is represented in red. The green circles and boxes indicate the maximum power frequencies and the vertical magenta dashed lines indicate the orbital period of HD 118203 b. Right panels: TESS photometry time series folded to the HD 118203 b orbital period as obtained from our global fit. The phase is referred to the planet’s time of inferior conjunction. The orange circles correspond to binned data of 10% the orbital phase.
Current usage metrics show cumulative count of Article Views (full-text article views including HTML views, PDF and ePub downloads, according to the available data) and Abstracts Views on Vision4Press platform.
Data correspond to usage on the plateform after 2015. The current usage metrics is available 48-96 hours after online publication and is updated daily on week days.
Initial download of the metrics may take a while.