Open Access
Fig. B.3
Download original image
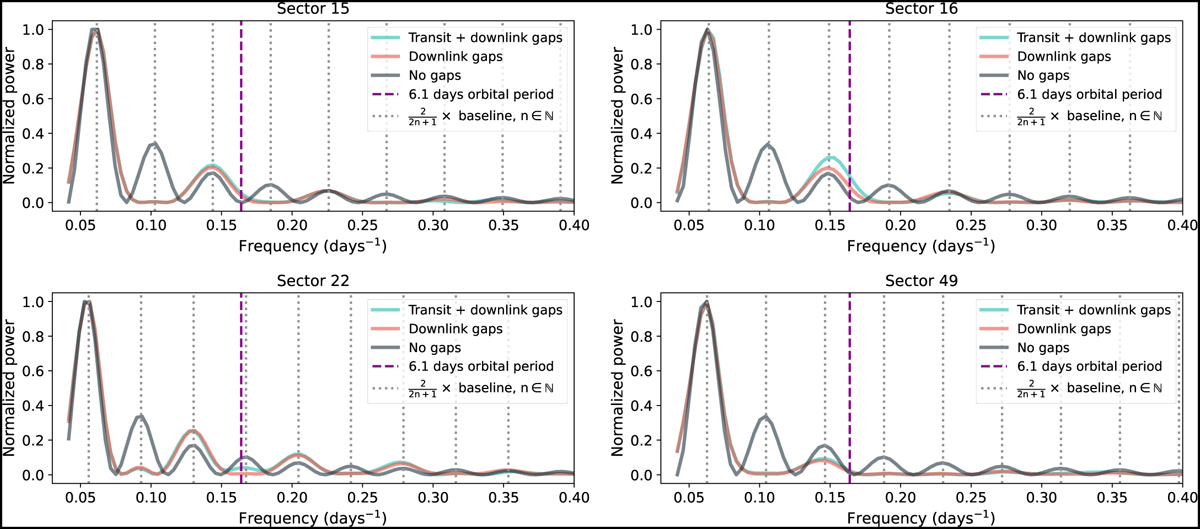
GLS periodograms of the TESS window functions with transit and downlink gaps (blue), downlink gaps alone (red), and no gaps (grey). In all cases, the maximum power periods correspond to two-thirds of the total sector baselines, which indicates that those periodicities are not related to the gaps.
Current usage metrics show cumulative count of Article Views (full-text article views including HTML views, PDF and ePub downloads, according to the available data) and Abstracts Views on Vision4Press platform.
Data correspond to usage on the plateform after 2015. The current usage metrics is available 48-96 hours after online publication and is updated daily on week days.
Initial download of the metrics may take a while.