Fig. 11
Download original image
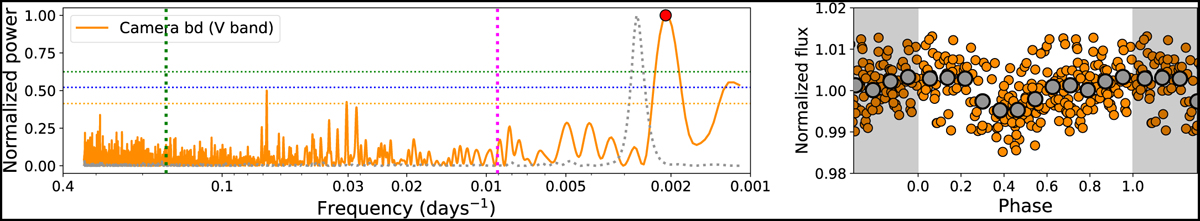
GLS periodogram of the ASAS-SN photometry acquired by the camera bd (solid orange) and its window function (dotted grey). The red circle indicates the maximum power frequency. The green dotted vertical line highlights the ≃6.1-day orbital period of HD 118203 b, and the magenta dotted vertical line indicates the ≃ 110-day periodicity found in the ELODIE FWHMs. The horizontal dotted lines correspond to the 10 (orange), 1 (blue), and 0.1 % (green) FAP levels. The right panel illustrates the phase-folded photometry to the maximum power period. The grey data points correspond to a 35-day binning.
Current usage metrics show cumulative count of Article Views (full-text article views including HTML views, PDF and ePub downloads, according to the available data) and Abstracts Views on Vision4Press platform.
Data correspond to usage on the plateform after 2015. The current usage metrics is available 48-96 hours after online publication and is updated daily on week days.
Initial download of the metrics may take a while.