Fig. 10
Download original image
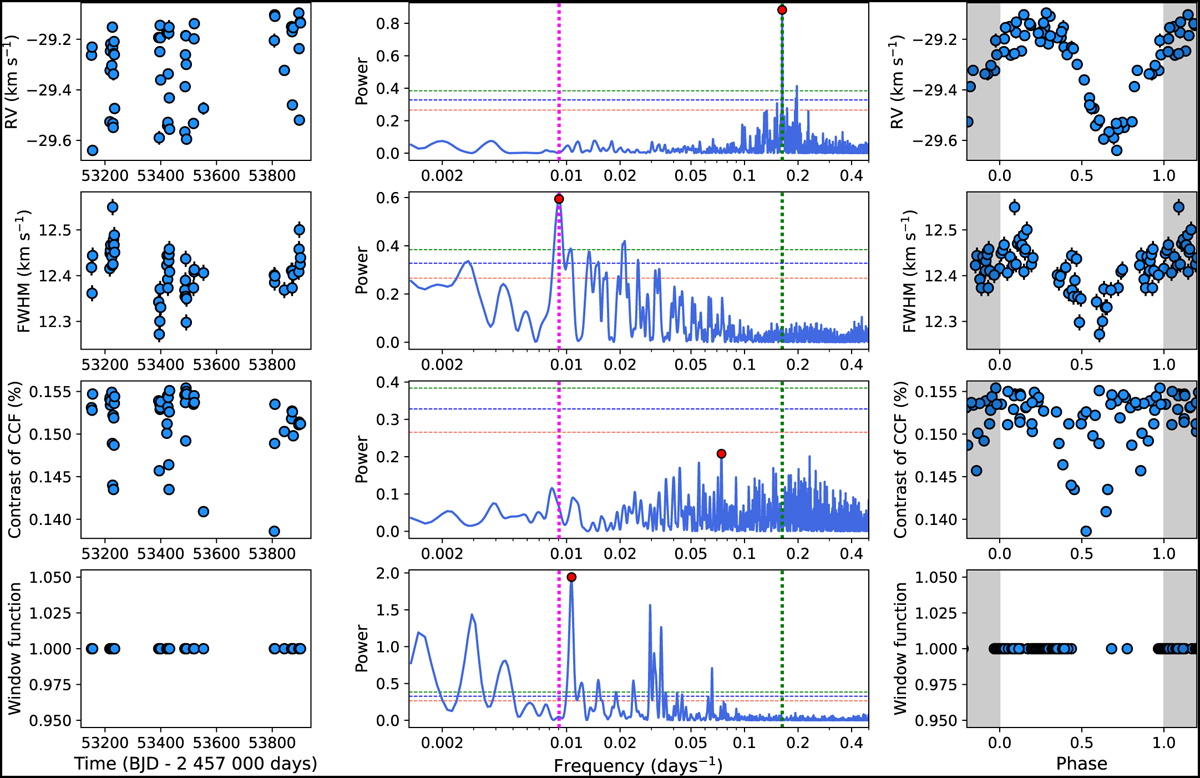
GLS periodograms of the ELODIE time series and window function. Left panels: time series of the ELODIE RVs, activity indicators described in Sect. 2.2, and window function of the observations. Centre panels: GLS periodogram of the time series and the window function. The red circle indicates the maximum power frequencies. The green dotted vertical lines highlight the ≃6.1-day orbital period of HD 118203 b. The magenta dotted vertical lines indicate the ≃110-day periodicity found in the ELODIE FWHMs. The horizontal dotted lines correspond to the 10 (orange), 1 (blue), and 0.1 % (green) FAP levels. Right panels: ELODIE time series and window function folded to the maximum power periods.
Current usage metrics show cumulative count of Article Views (full-text article views including HTML views, PDF and ePub downloads, according to the available data) and Abstracts Views on Vision4Press platform.
Data correspond to usage on the plateform after 2015. The current usage metrics is available 48-96 hours after online publication and is updated daily on week days.
Initial download of the metrics may take a while.